Module 13: Identify Patterns, Part 3
AI Visual Key Influencers
Descriptive vs diagnostic analysis. Descriptive analysis is used to summarize and describe the main features of a dataset, while diagnostic analysis is used to identify the causes of a particular outcome or trend. The AI visual key influencers feature in Power BI can help you perform both types of analysis by automatically identifying the key factors that influence a particular outcome or trend in your data. What factors influence the outcome or trend? The AI visual key influencers feature can help you identify the key factors that are driving a particular outcome or trend in your data. This can be useful for understanding the underlying causes of a particular trend and making more informed decisions based on your analysis.
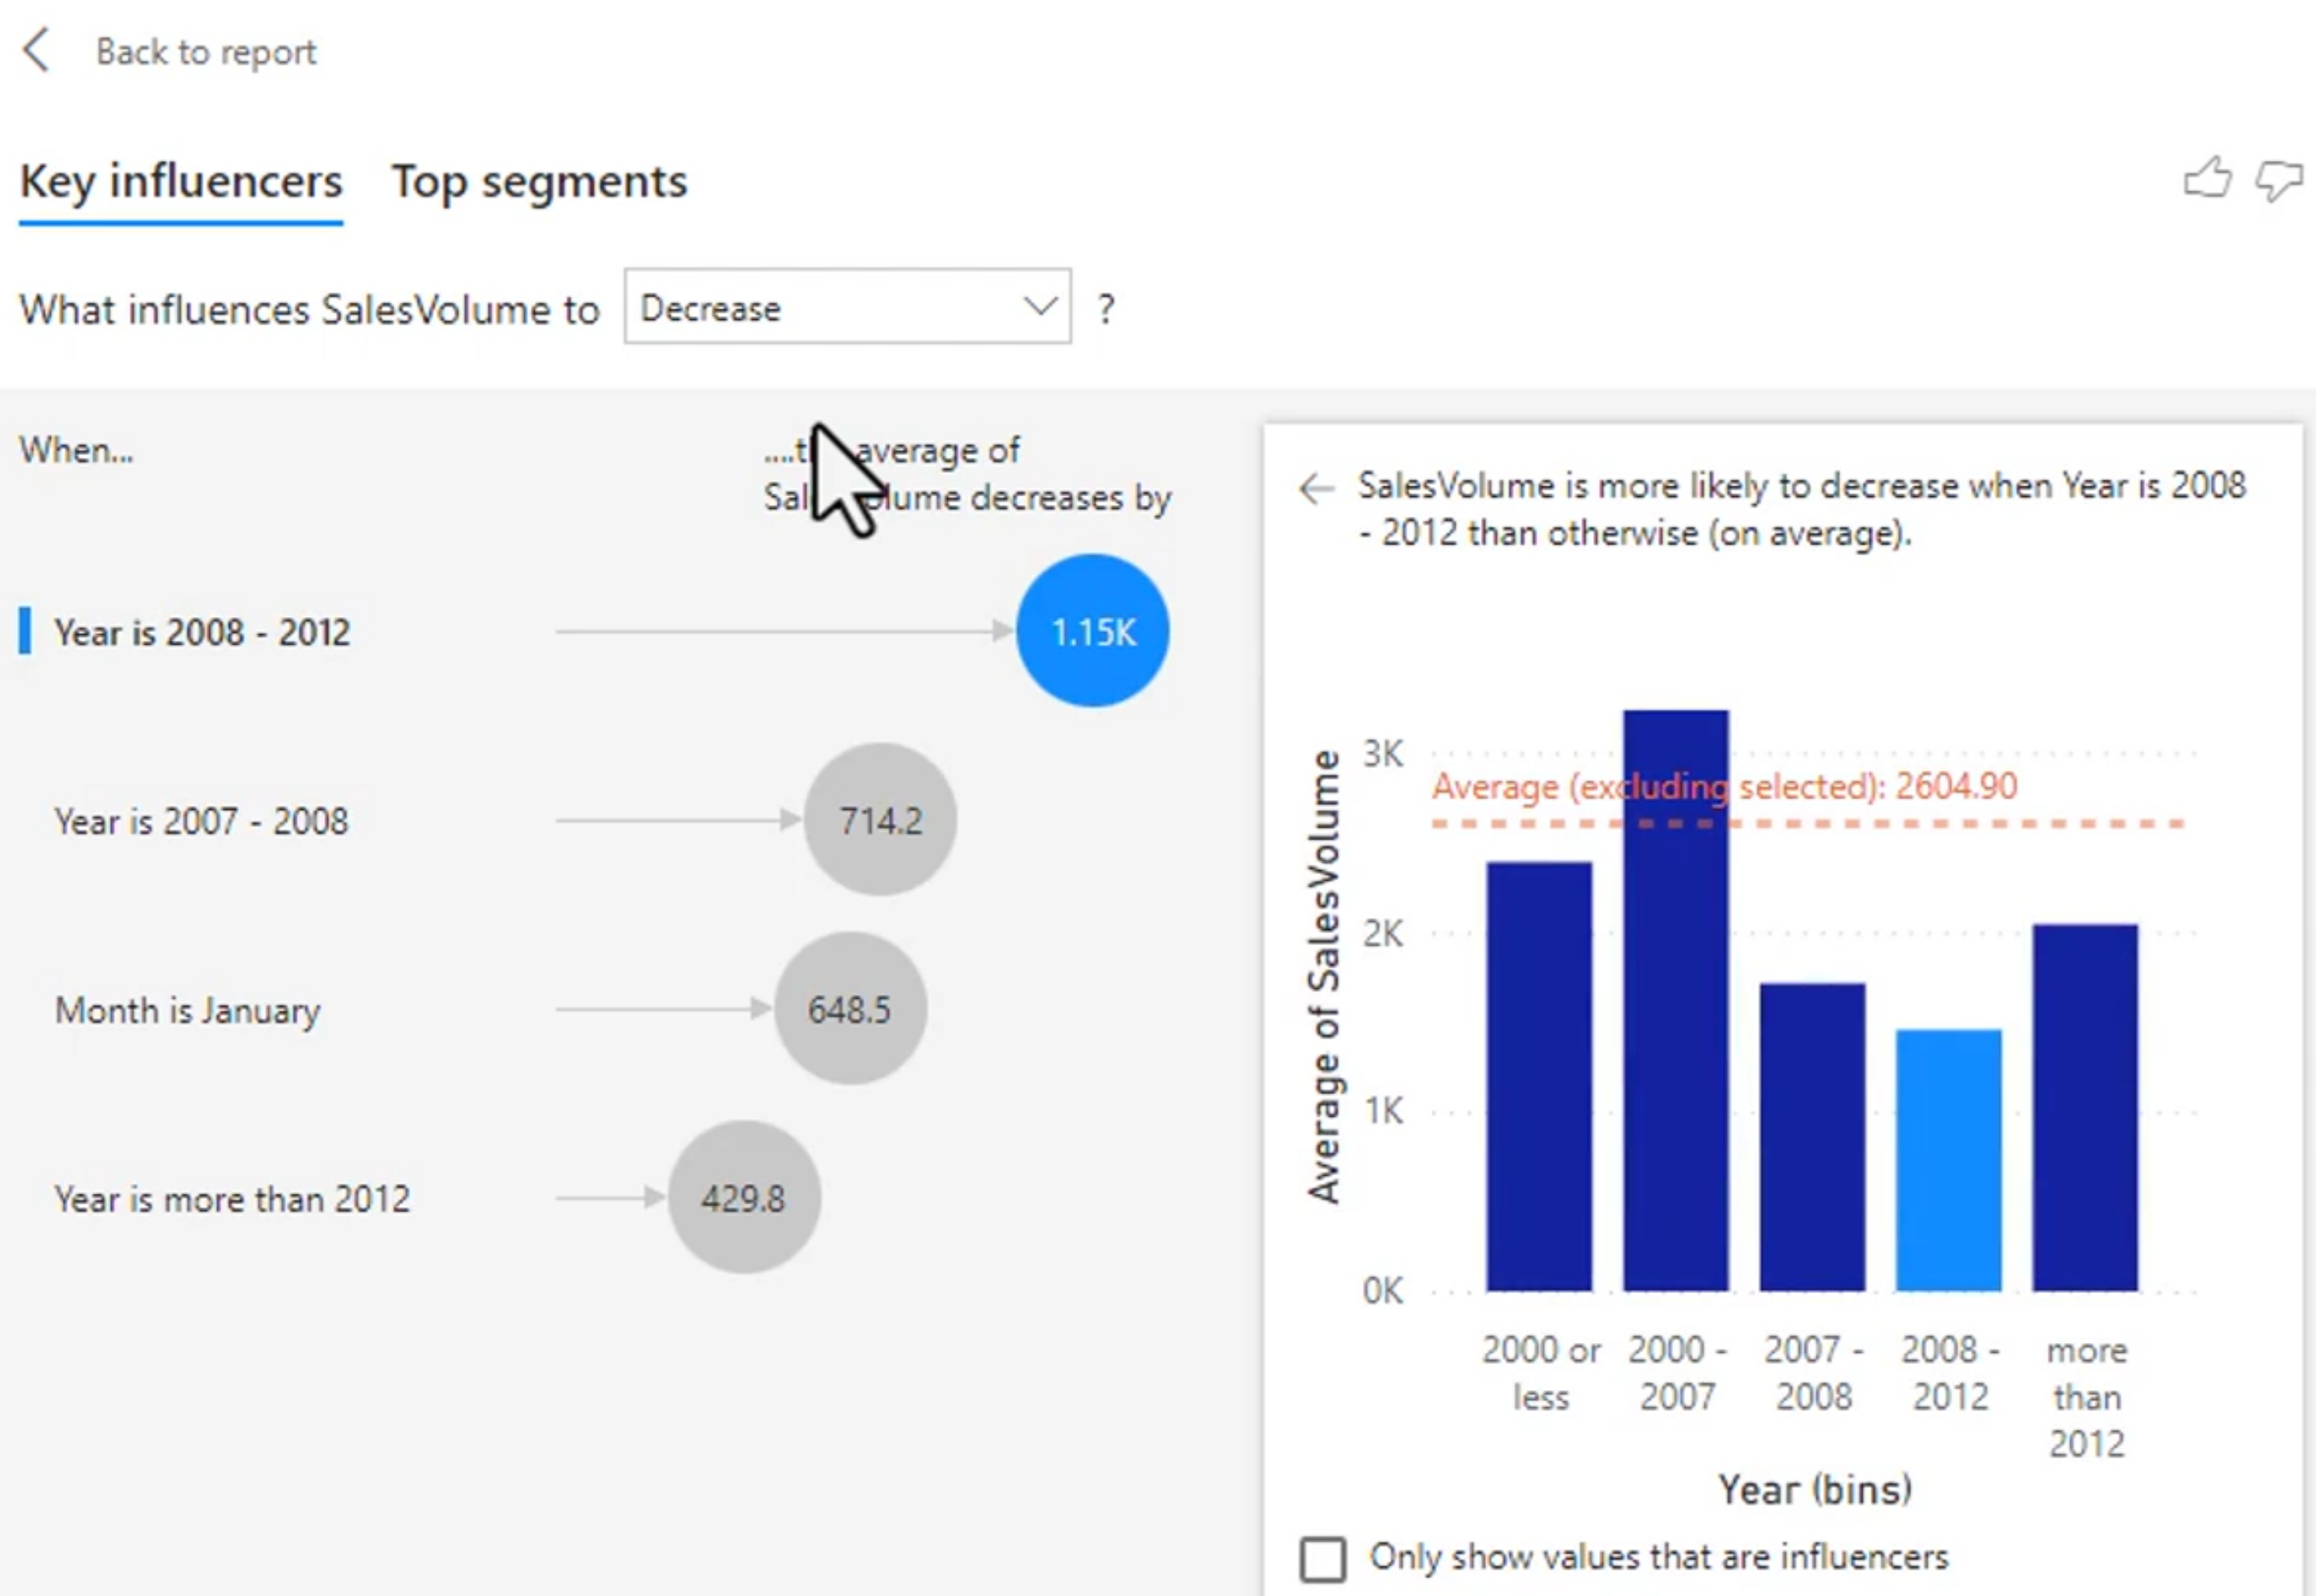
Key influencers is a diagnostic visual. You choose an outcome to analyze and add fields that Power BI can test as possible explanations. For example, you could analyze high profit, late deliveries, customer churn, or a high satisfaction score. The visual ranks factors associated with the selected outcome.
Association is not the same as causation. A factor may be correlated with the outcome because another field or process affects both. Treat the result as evidence for further investigation and validate important conclusions with source data and subject-matter experts.
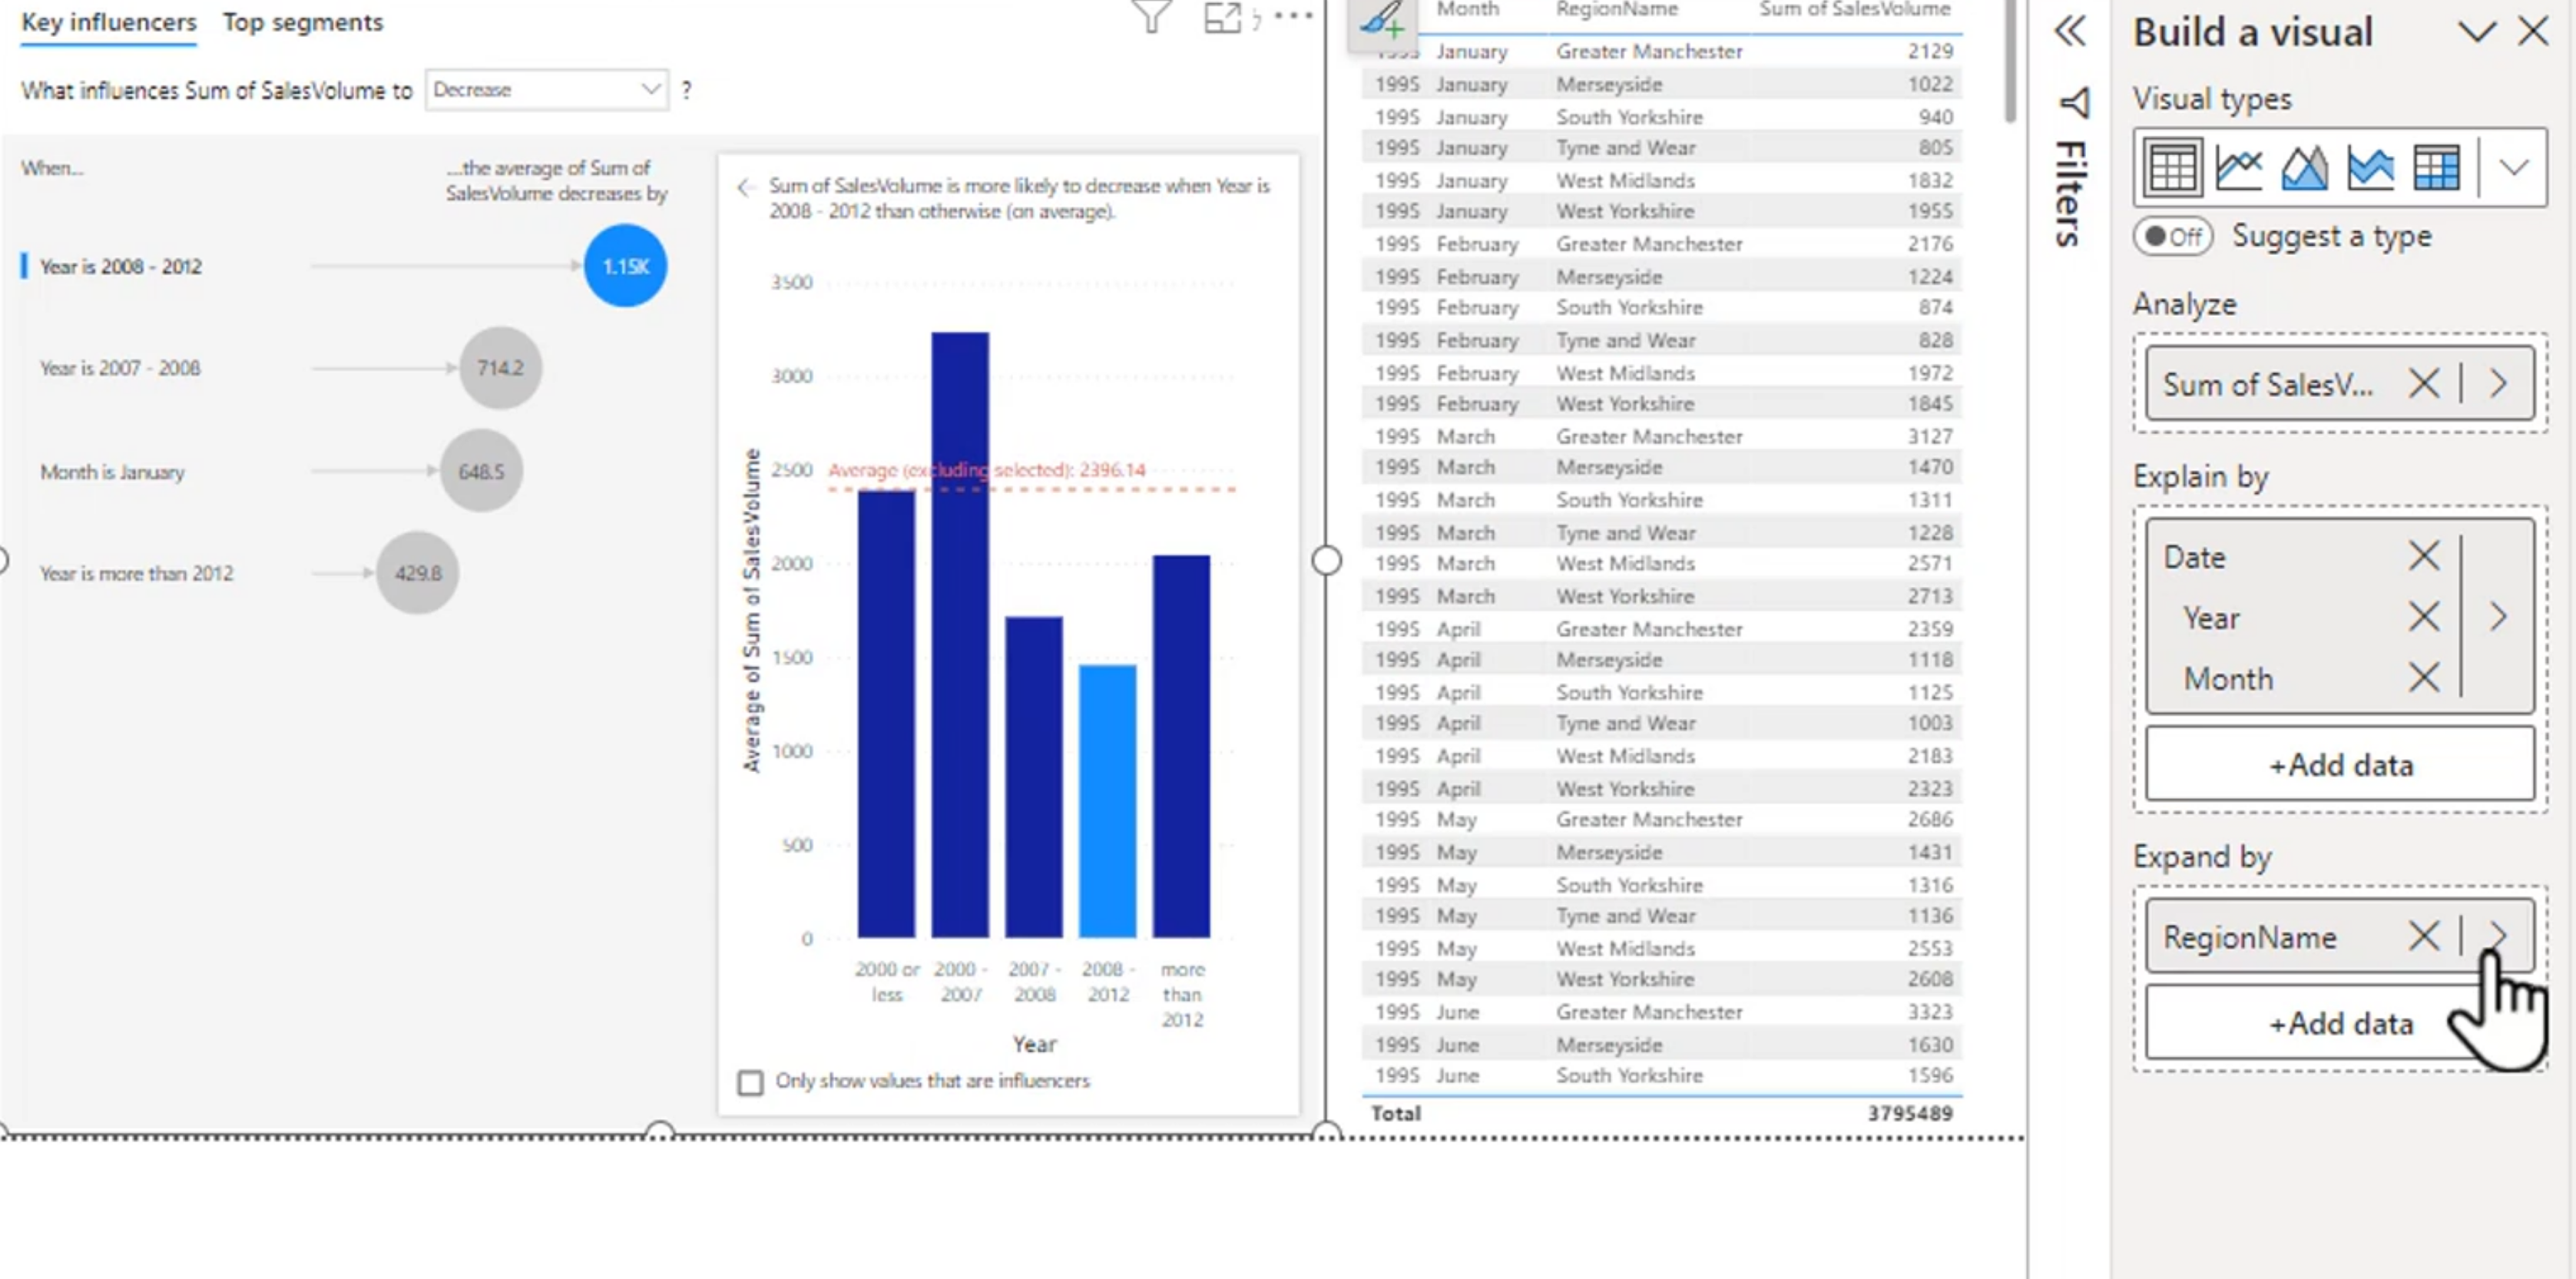
- Analyze:
- What is happening in your data?
- What are the key factors that are driving this outcome or trend?
- Explain by:
- What are the key factors that are driving this outcome or trend?
- How do these factors interact with each other to influence the outcome or trend?
- Expand by:
- What are the key factors that are driving this outcome or trend?
- How do these factors interact with each other to influence the outcome or trend?
- What are the potential implications of these factors for your business or organization?
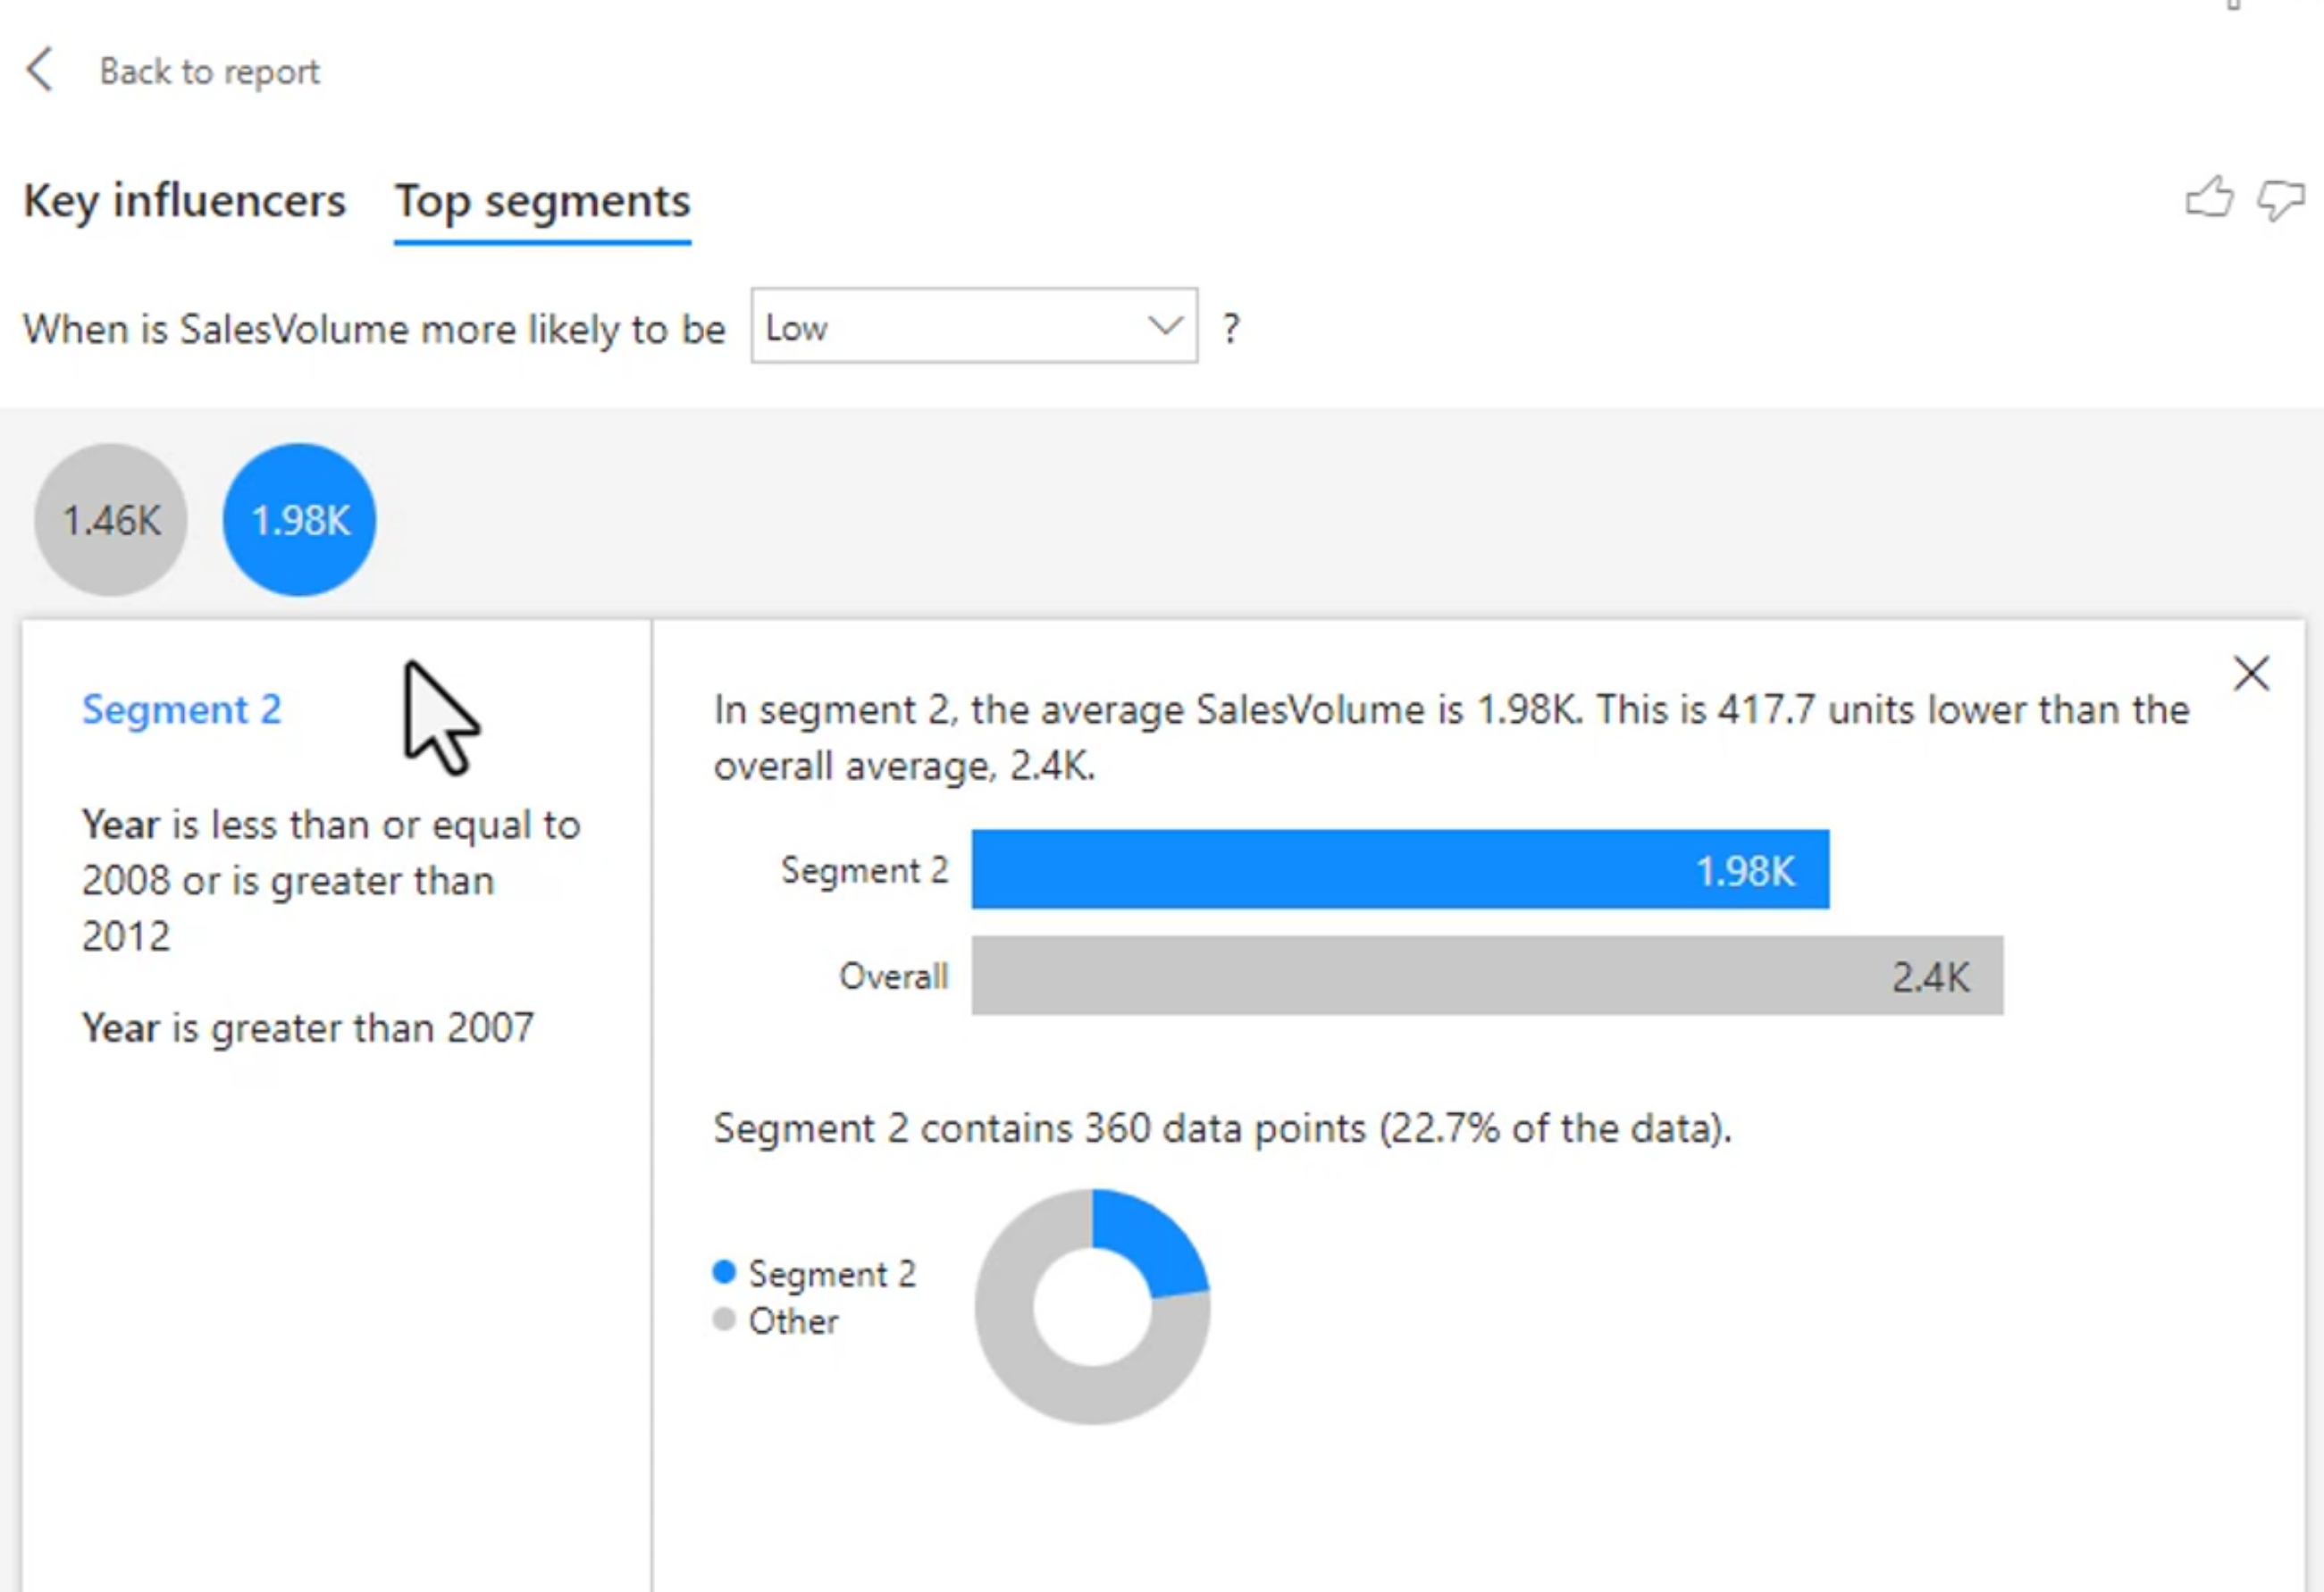
Top Segments are two different ways to look at the data. The first is to look at the top segments that are driving the outcome or trend, while the second is to look at the top segments that are being influenced by the outcome or trend. This can help you identify potential opportunities or risks in your data and make more informed decisions.
Formatting Key Influencers
Use a clear outcome label and make the analyzed measure understandable to the audience. Review the number of observations behind each factor, because a strong-looking result based on very few records may not generalize.
Numeric factors describe how a change in a value is associated with the outcome. Categorical factors compare one category with other categories. Top segments combine conditions to describe groups of records that share a meaningful pattern.
- Counts:
- The number of occurrences of a particular value or category in your data. This can be useful for understanding the distribution of your data and identifying patterns or trends.
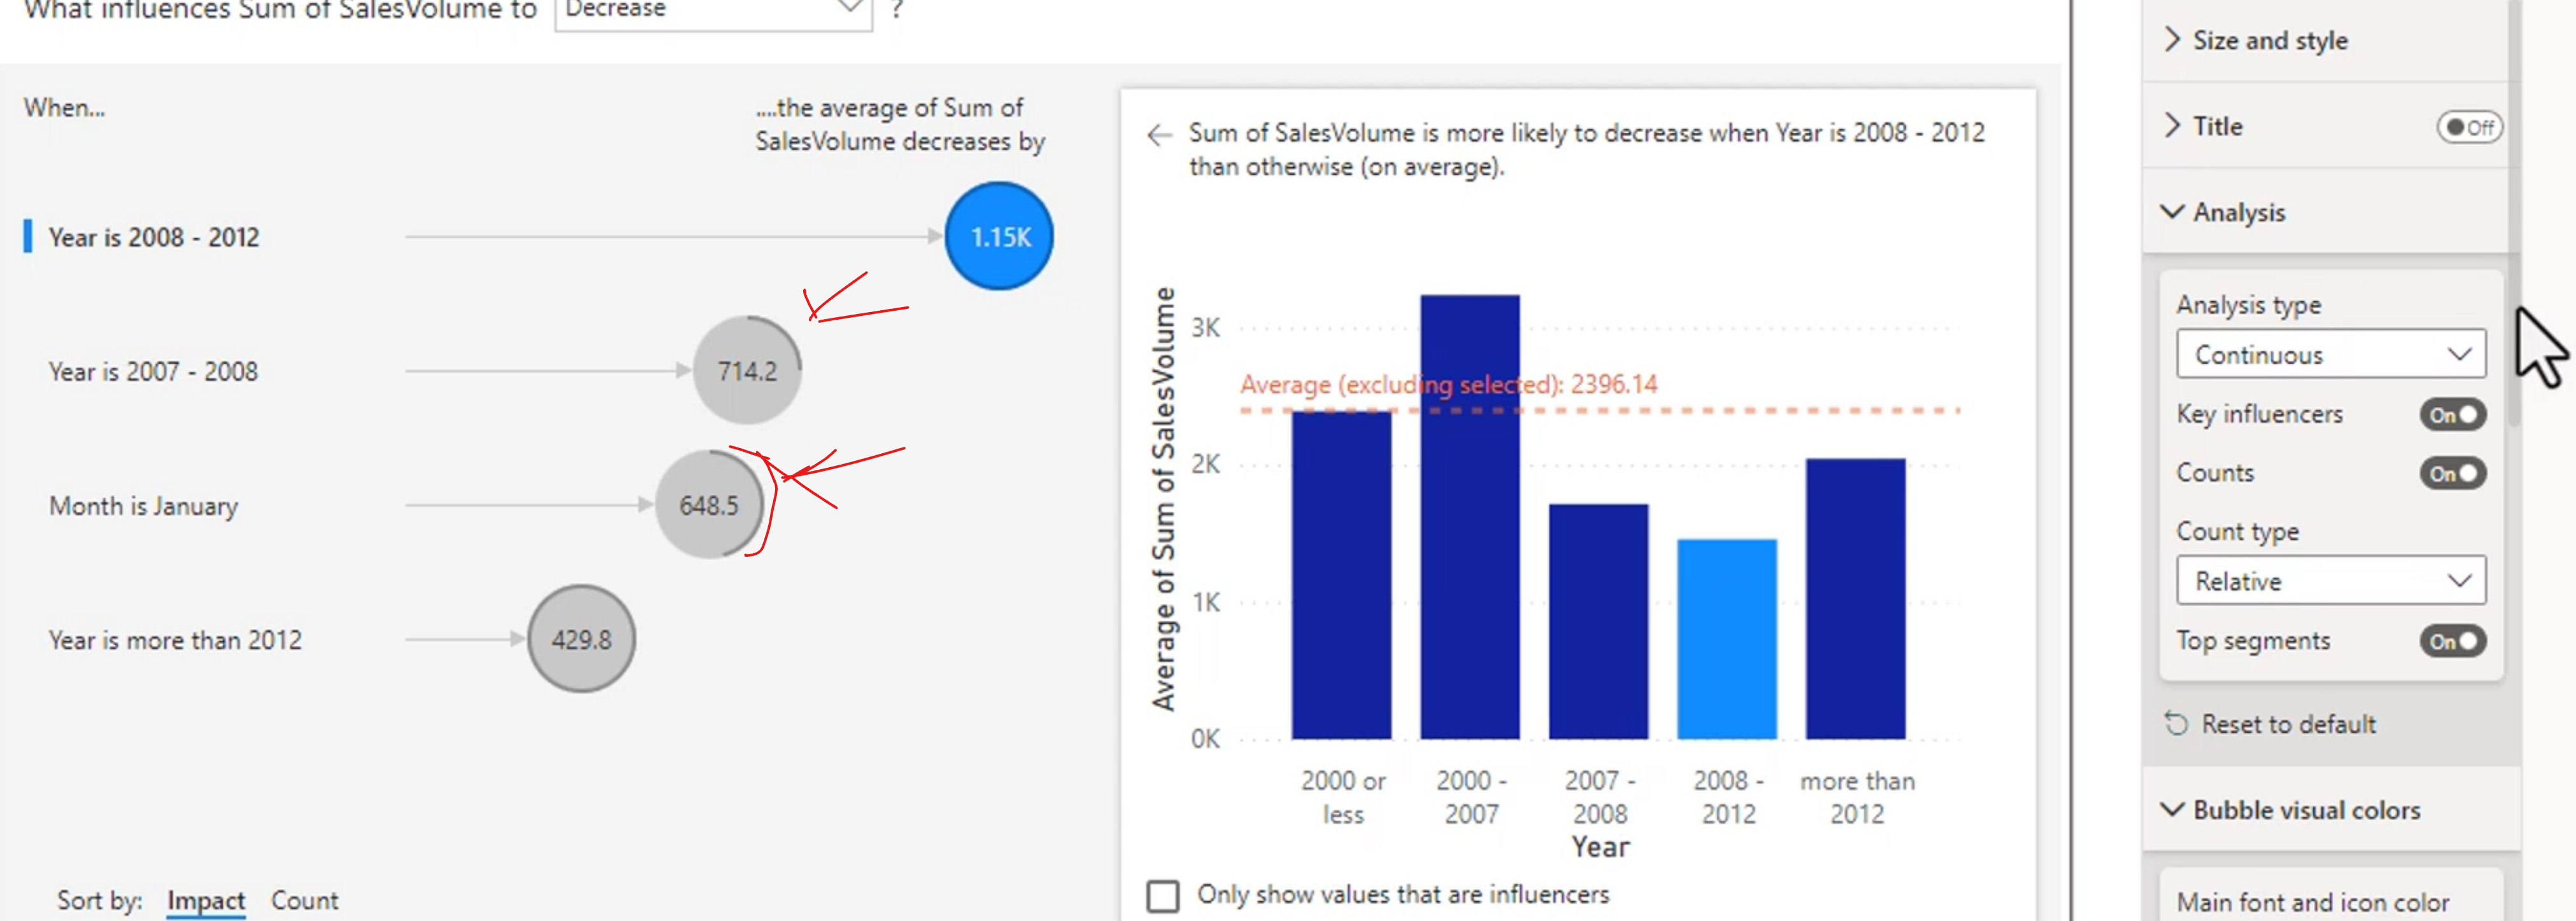
- The number of occurrences of a particular value or category in your data. This can be useful for understanding the distribution of your data and identifying patterns or trends.
Analyze Feature
The analyze feature in Power BI allows you to perform advanced analysis on your data using machine learning algorithms. This can be useful for identifying patterns and trends in your data that may not be immediately apparent. The analyze feature can help you uncover hidden insights and make more informed decisions based on your analysis.
This will try to find patterns in your data and provide insights into what is driving those patterns. You can use the analyze feature to identify key factors that are influencing a particular outcome or trend in your data, and you can also use it to explore potential relationships between different variables in your dataset.
You can give feedback or the plus sign to add it to your report. You can also customize the analyze feature by changing the title, font size, and other formatting options to match the overall design of your report. This can help to create a cohesive and professional-looking report that is easy to read and understand.
There are different visualizations for each of your different types of data.
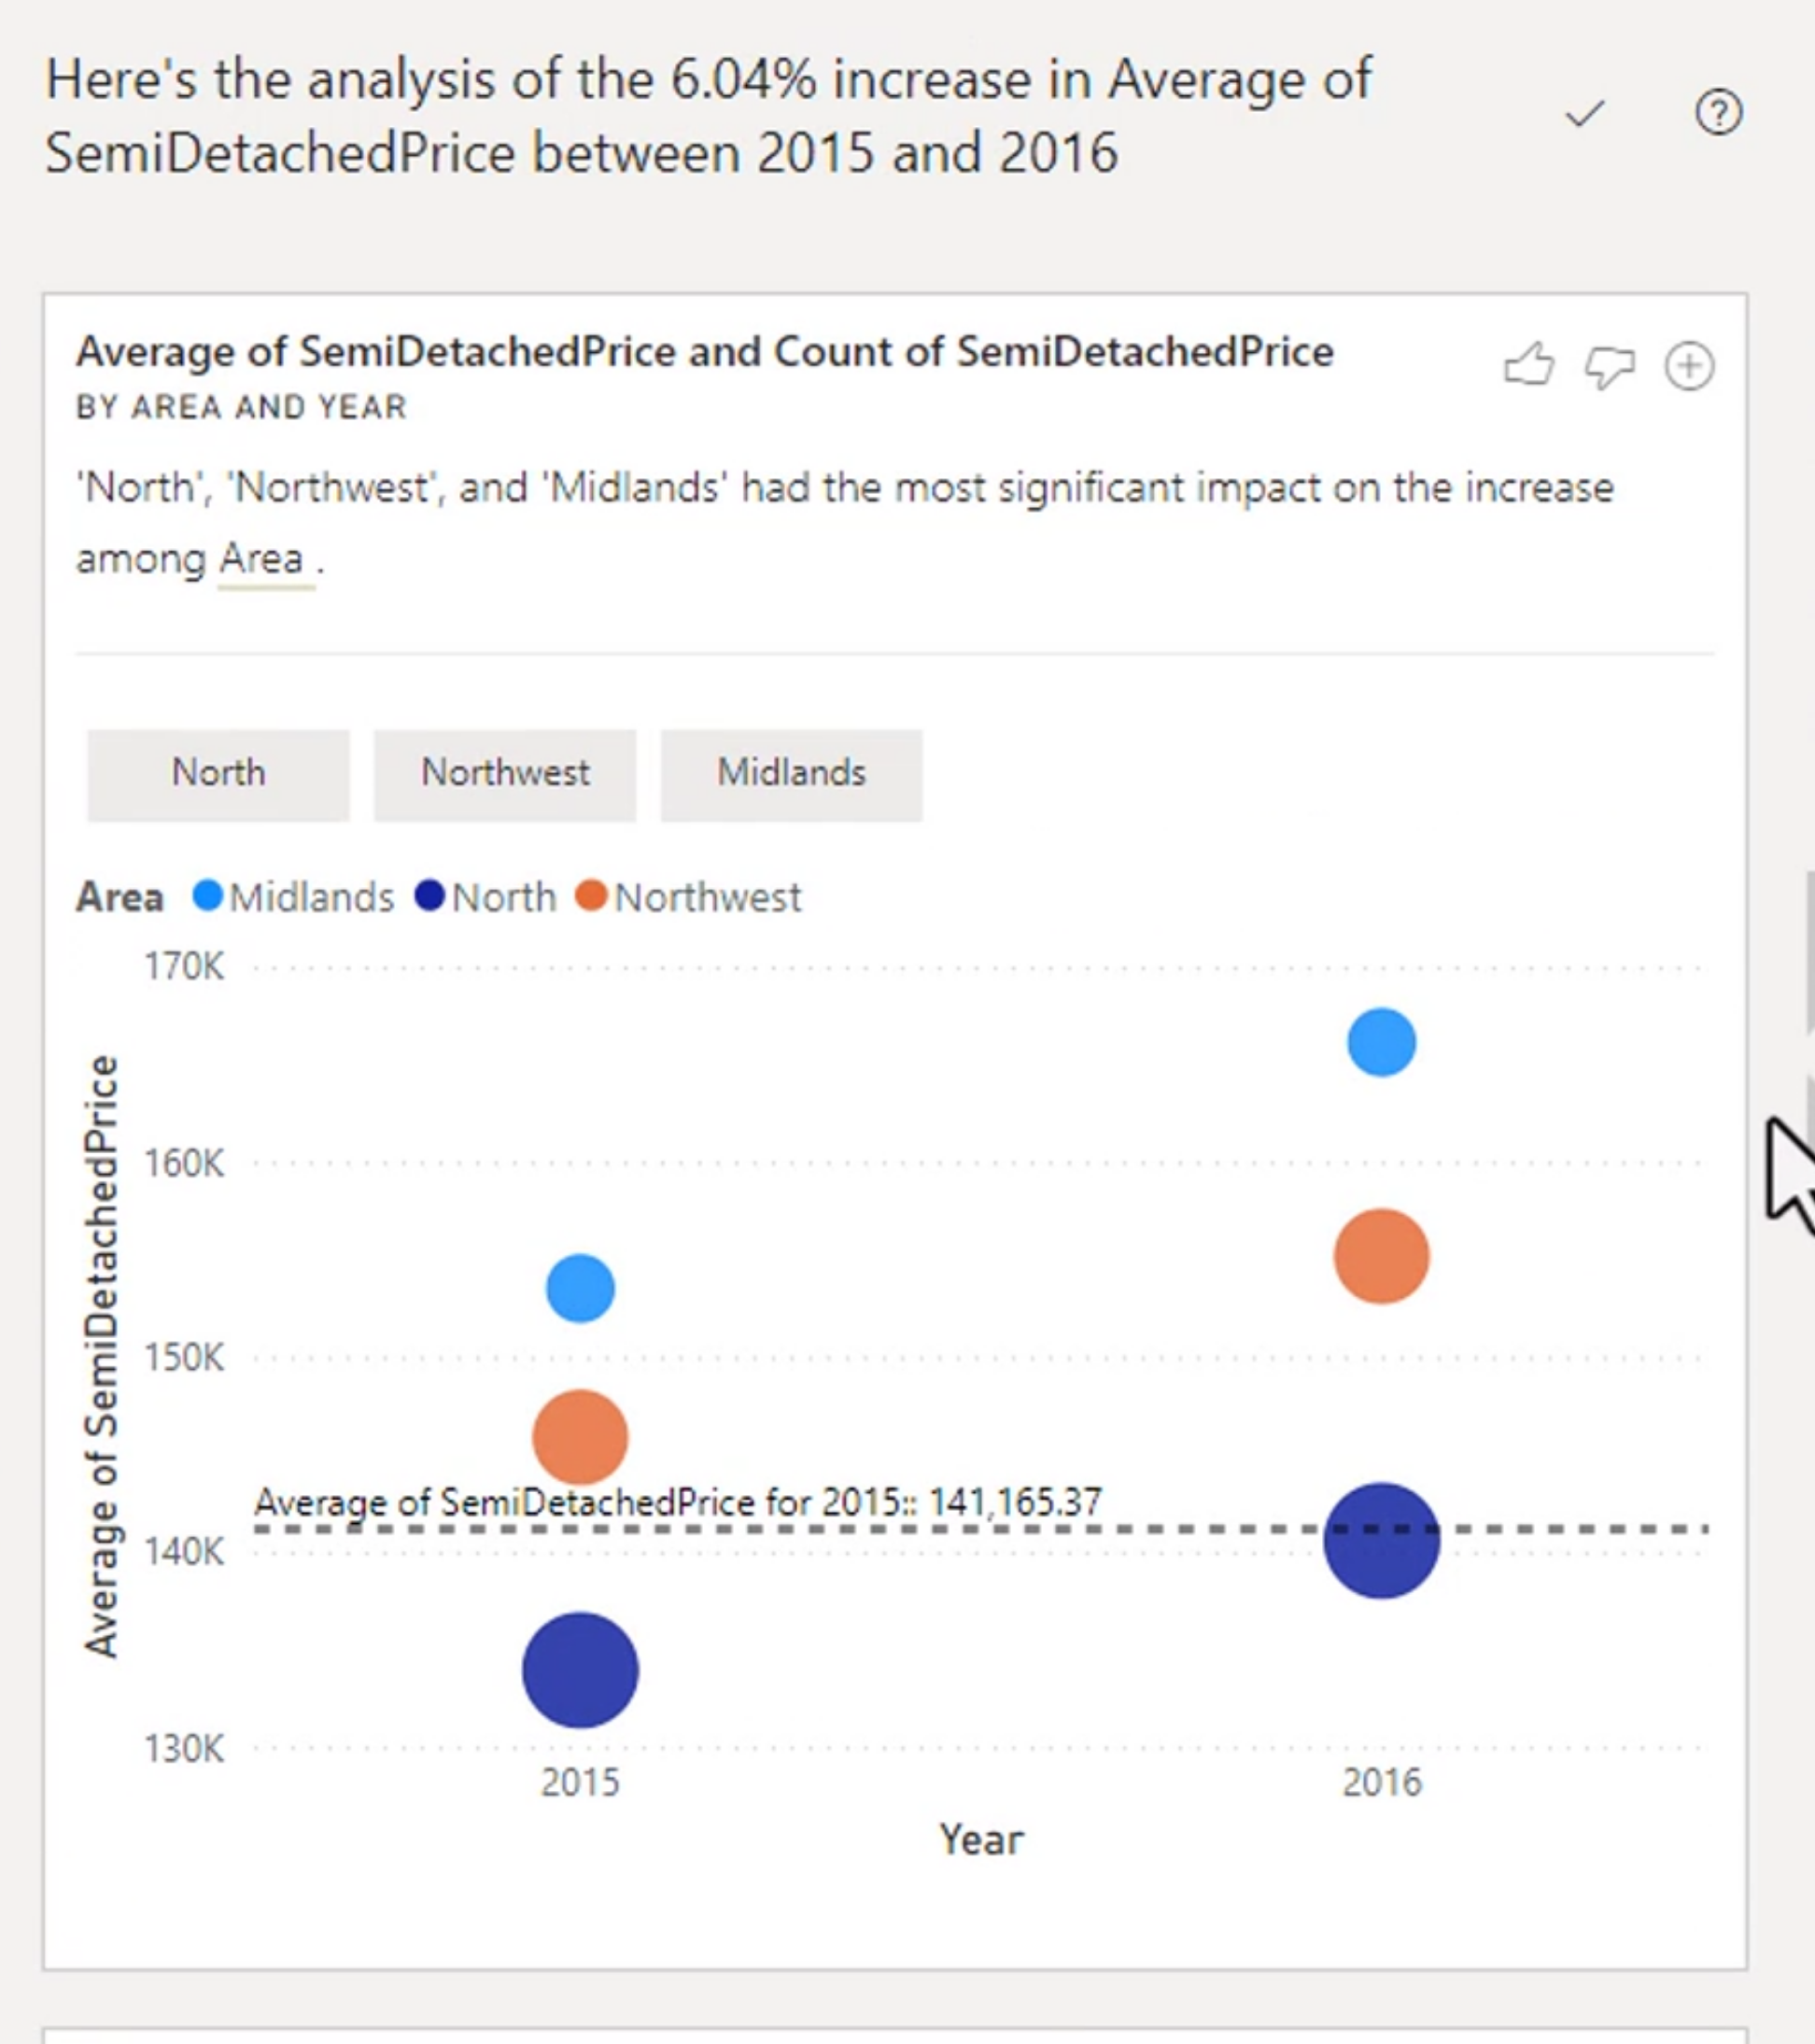
Find where this distribution is different is another powerful option that compares one group with the rest of the data. It can help identify categories, periods, or segments where the distribution of a measure is noticeably different from the overall population.
Note: The Analyze feature will not work with some types of filters like TopN
Some automatic insights are unavailable when the visual uses unsupported filters, unusual aggregations, or insufficient data. If the feature is unavailable, simplify the visual, review the filter context, or perform the comparison manually with measures and standard visuals.
AI Visual Composition Tree Visual
The decomposition tree visual breaks down a measure across several dimensions. It is useful when you want to move from an overall result to the categories, regions, products, or other fields that make up that result.
Start by placing a measure in Analyze and possible breakdown fields in Explain by. Users can expand one branch at a time and explore the composition of the measure without creating a separate visual for every combination.
The AI split can suggest a branch with a particularly high or low value, but the suggestion still needs business context. A branch with a high total may simply contain more records, so compare totals with counts, rates, or other normalized measures when appropriate.
One way is to do it like this:
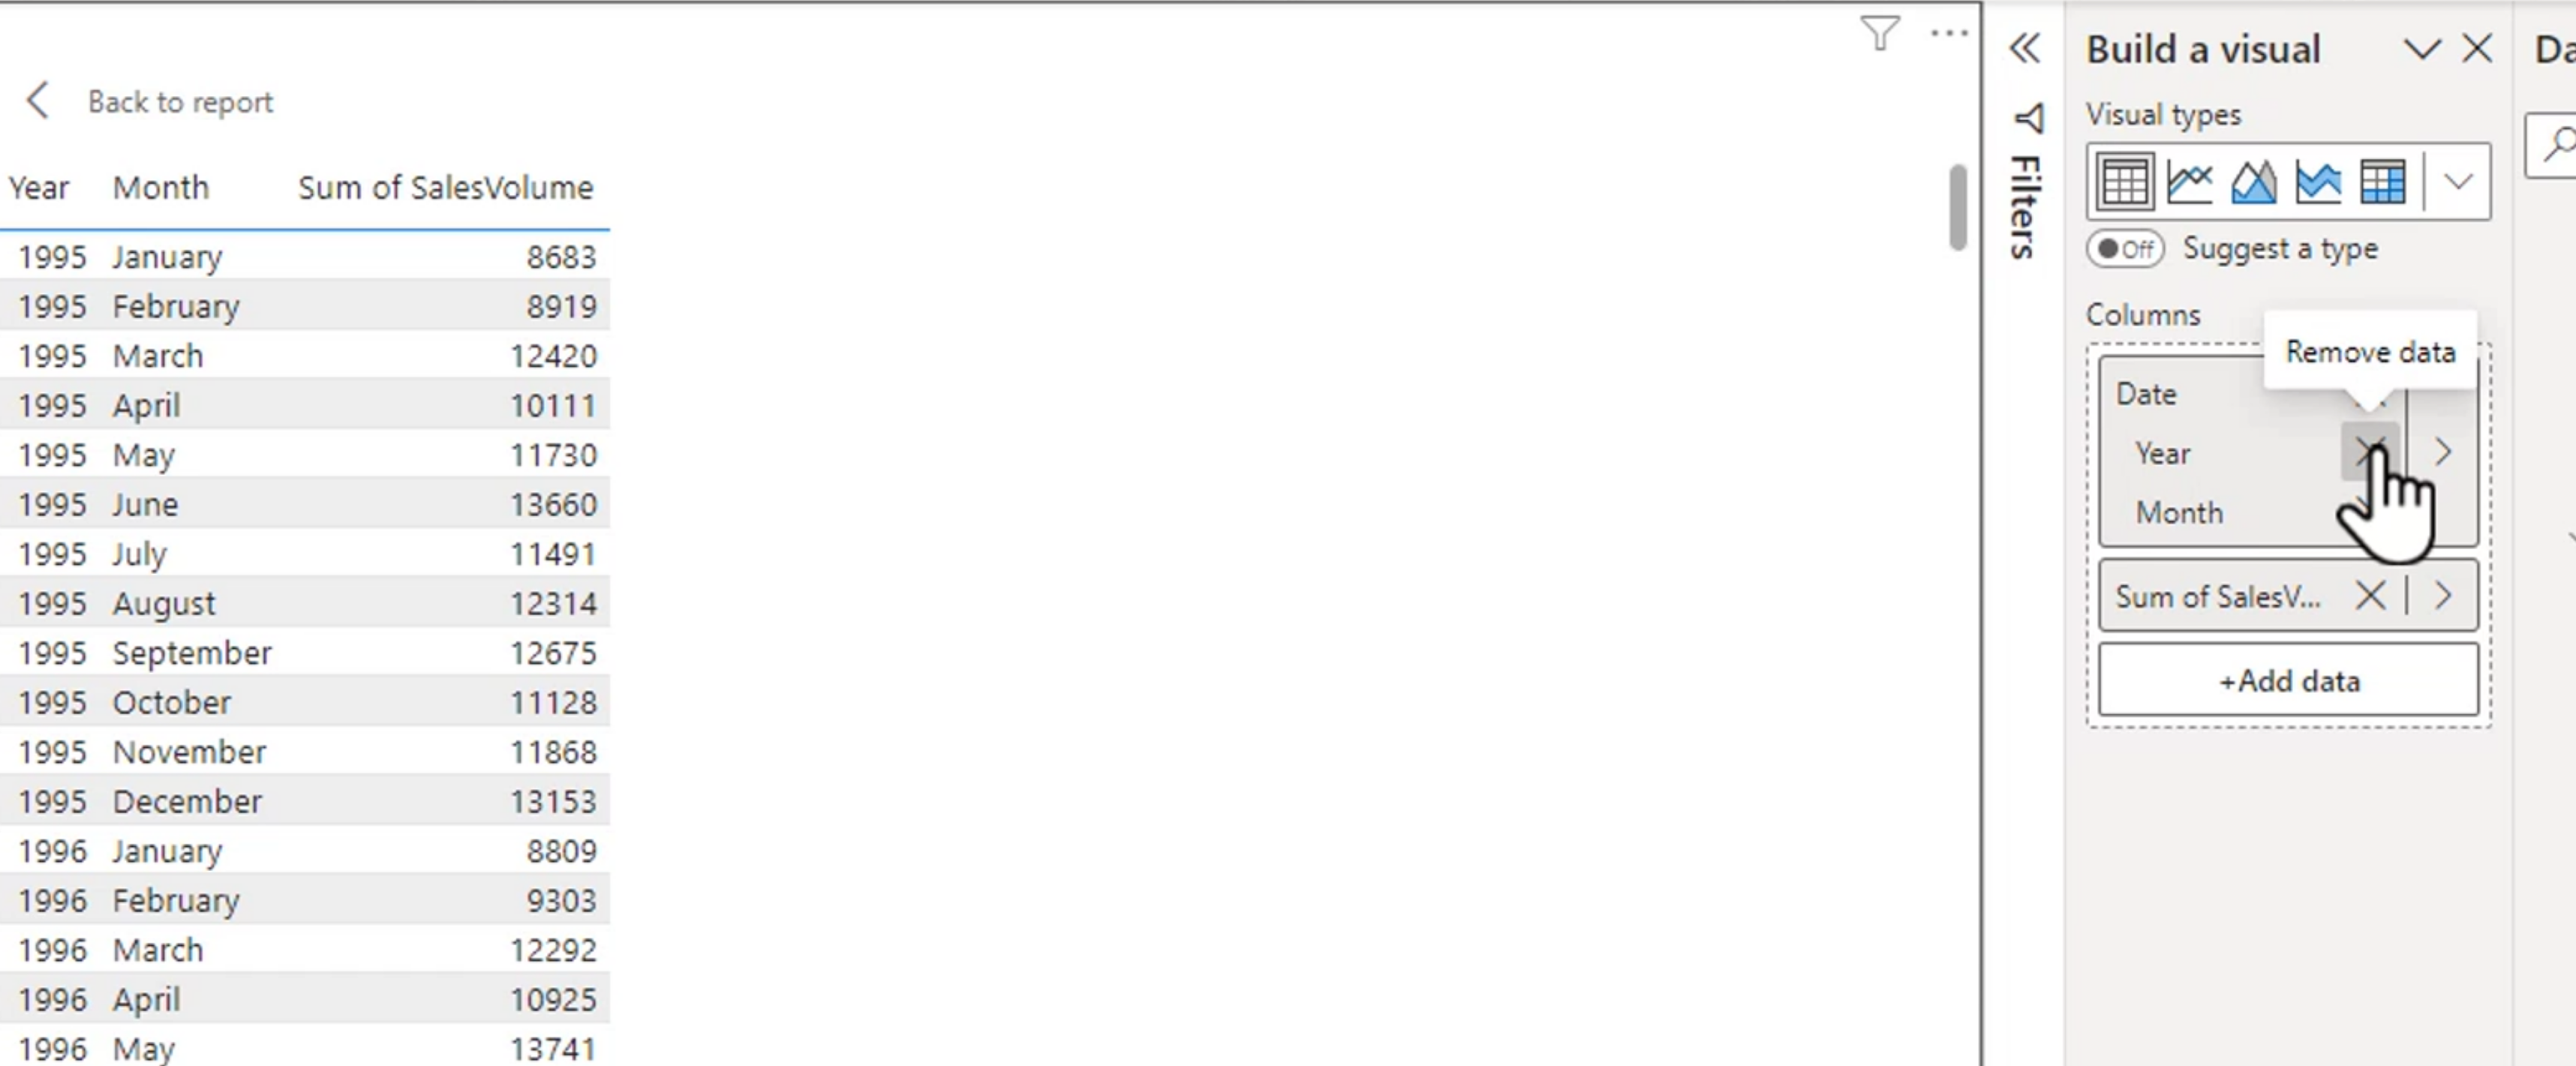
But now we can make a tree that expands it and it looks like this:
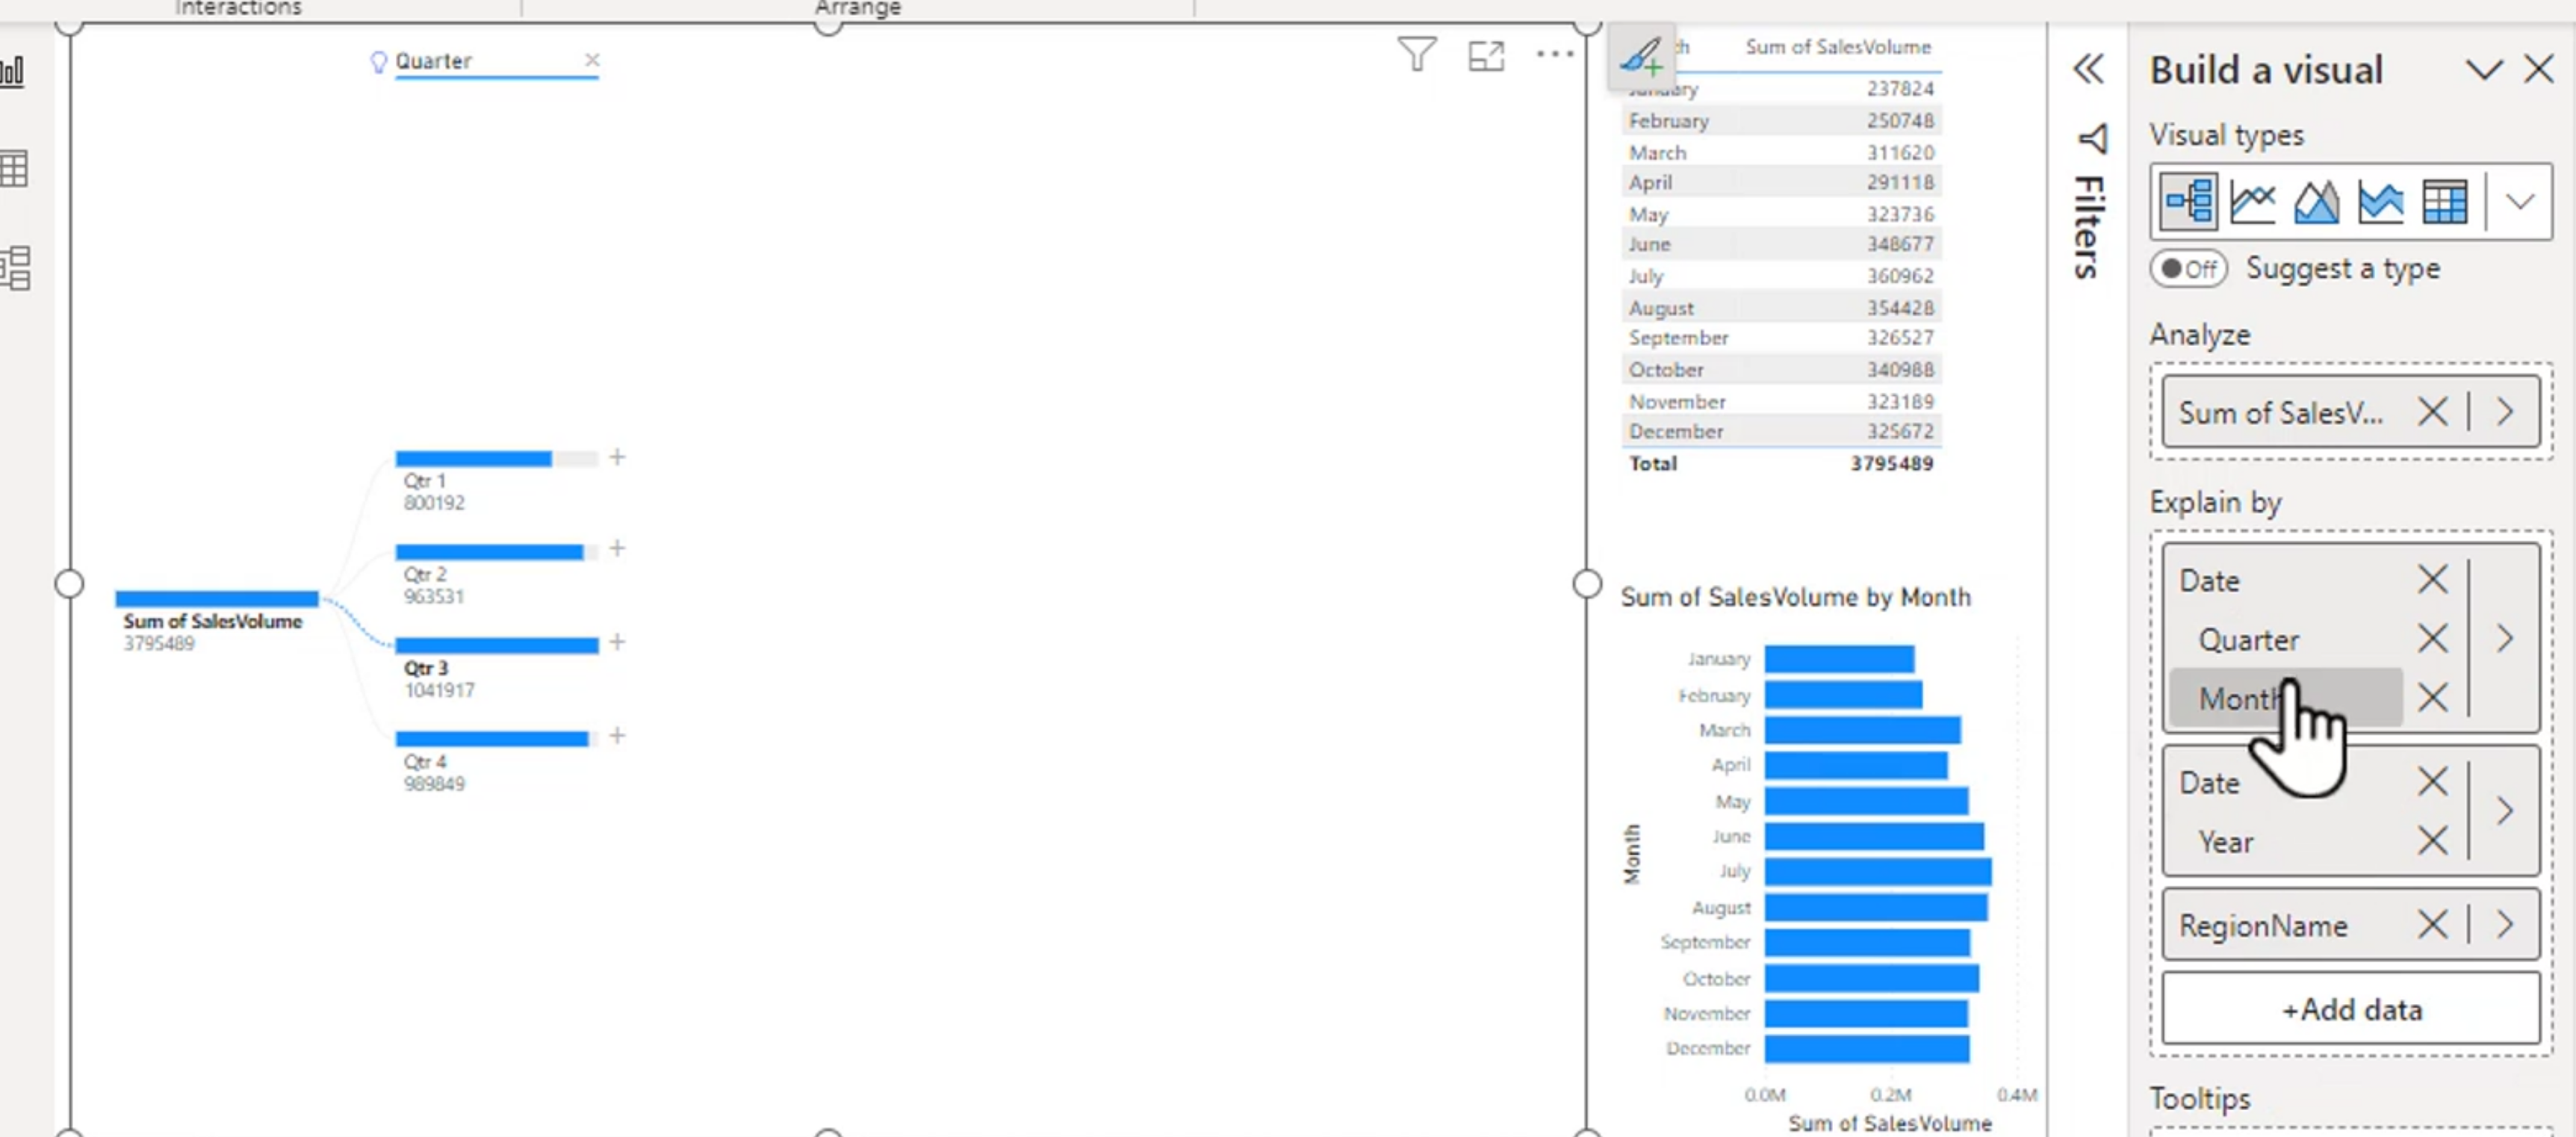
It allows you to explore and see how you can break a measure down into a visual way of seeing what makes up the entirety of it.
Design and Configure for Accessibility
Use Windows accessibility settings to test the report with keyboard navigation and other assistive features. Tab and Shift+Tab move through visualizations and controls in the report's navigation order.
You can organize the tab order by using the selection pane in BI.
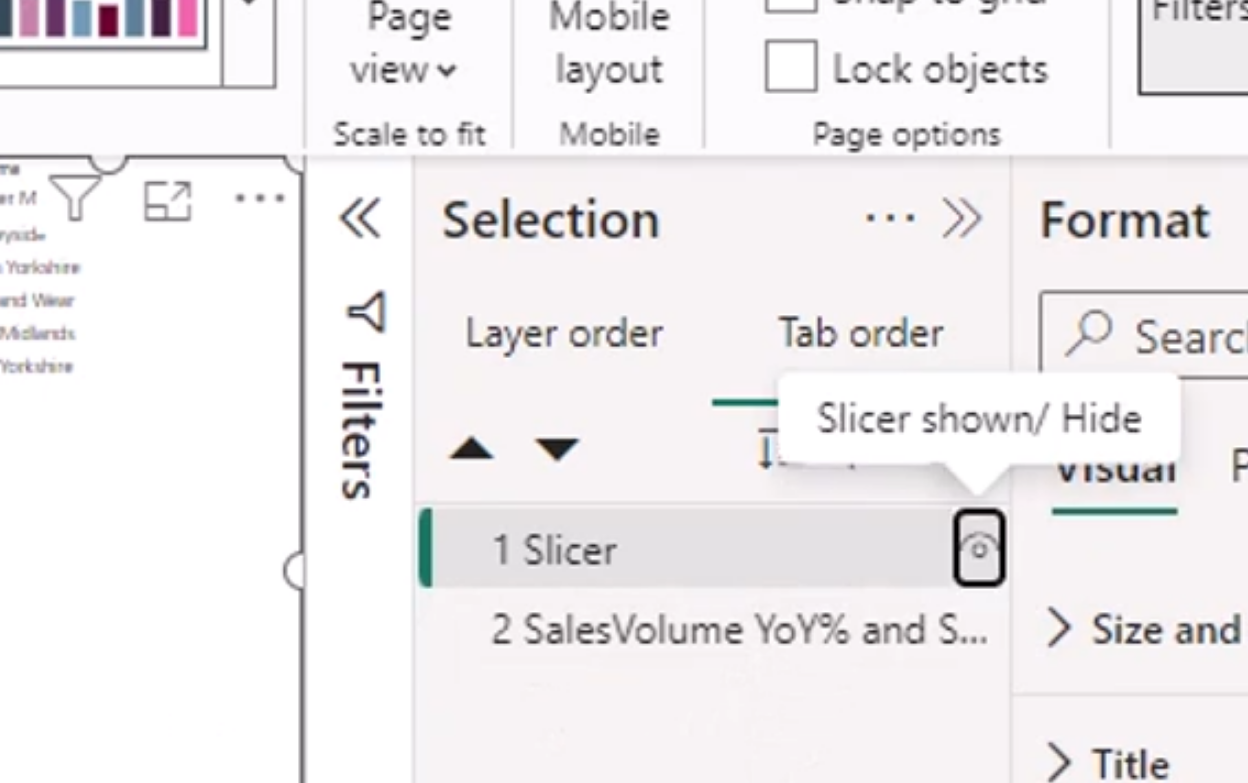
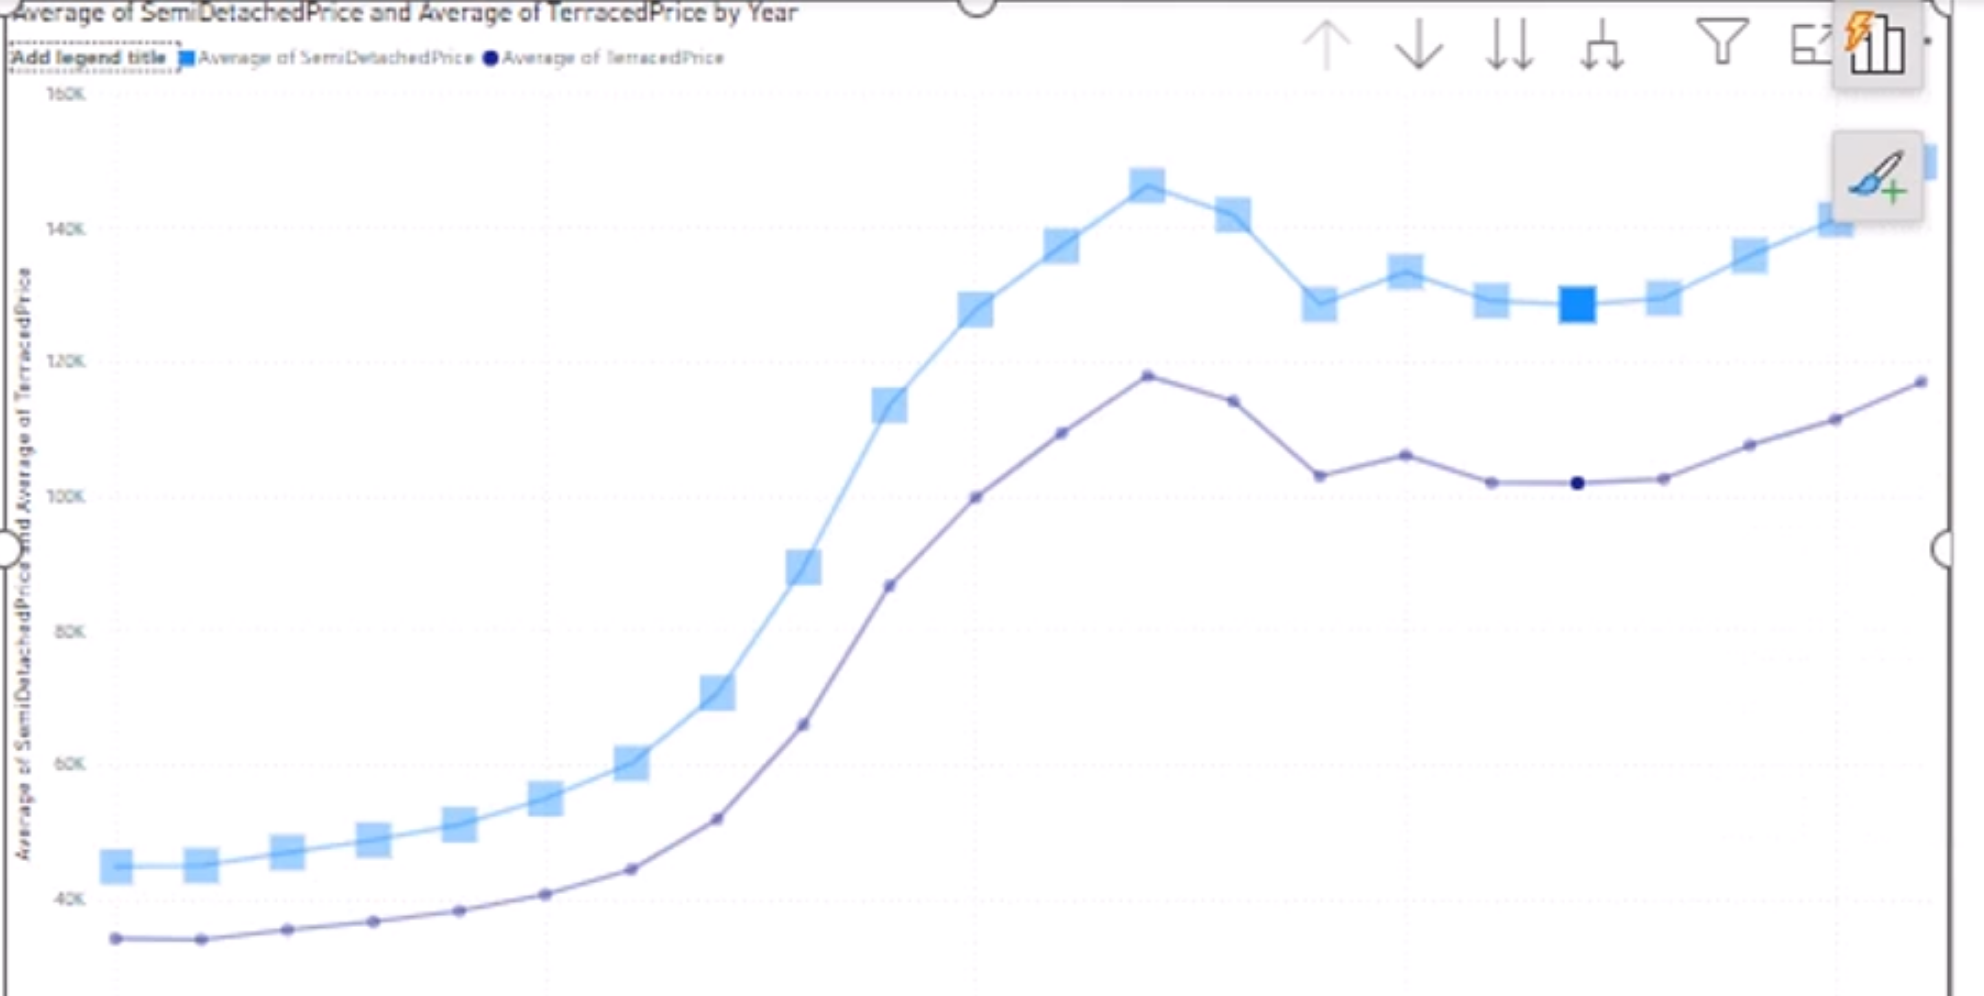
Instead of relying on different colors for each line, use different shapes, dash styles, markers, or direct labels where the visual supports them. Test the report with a keyboard and with an accessibility checker before sharing it.
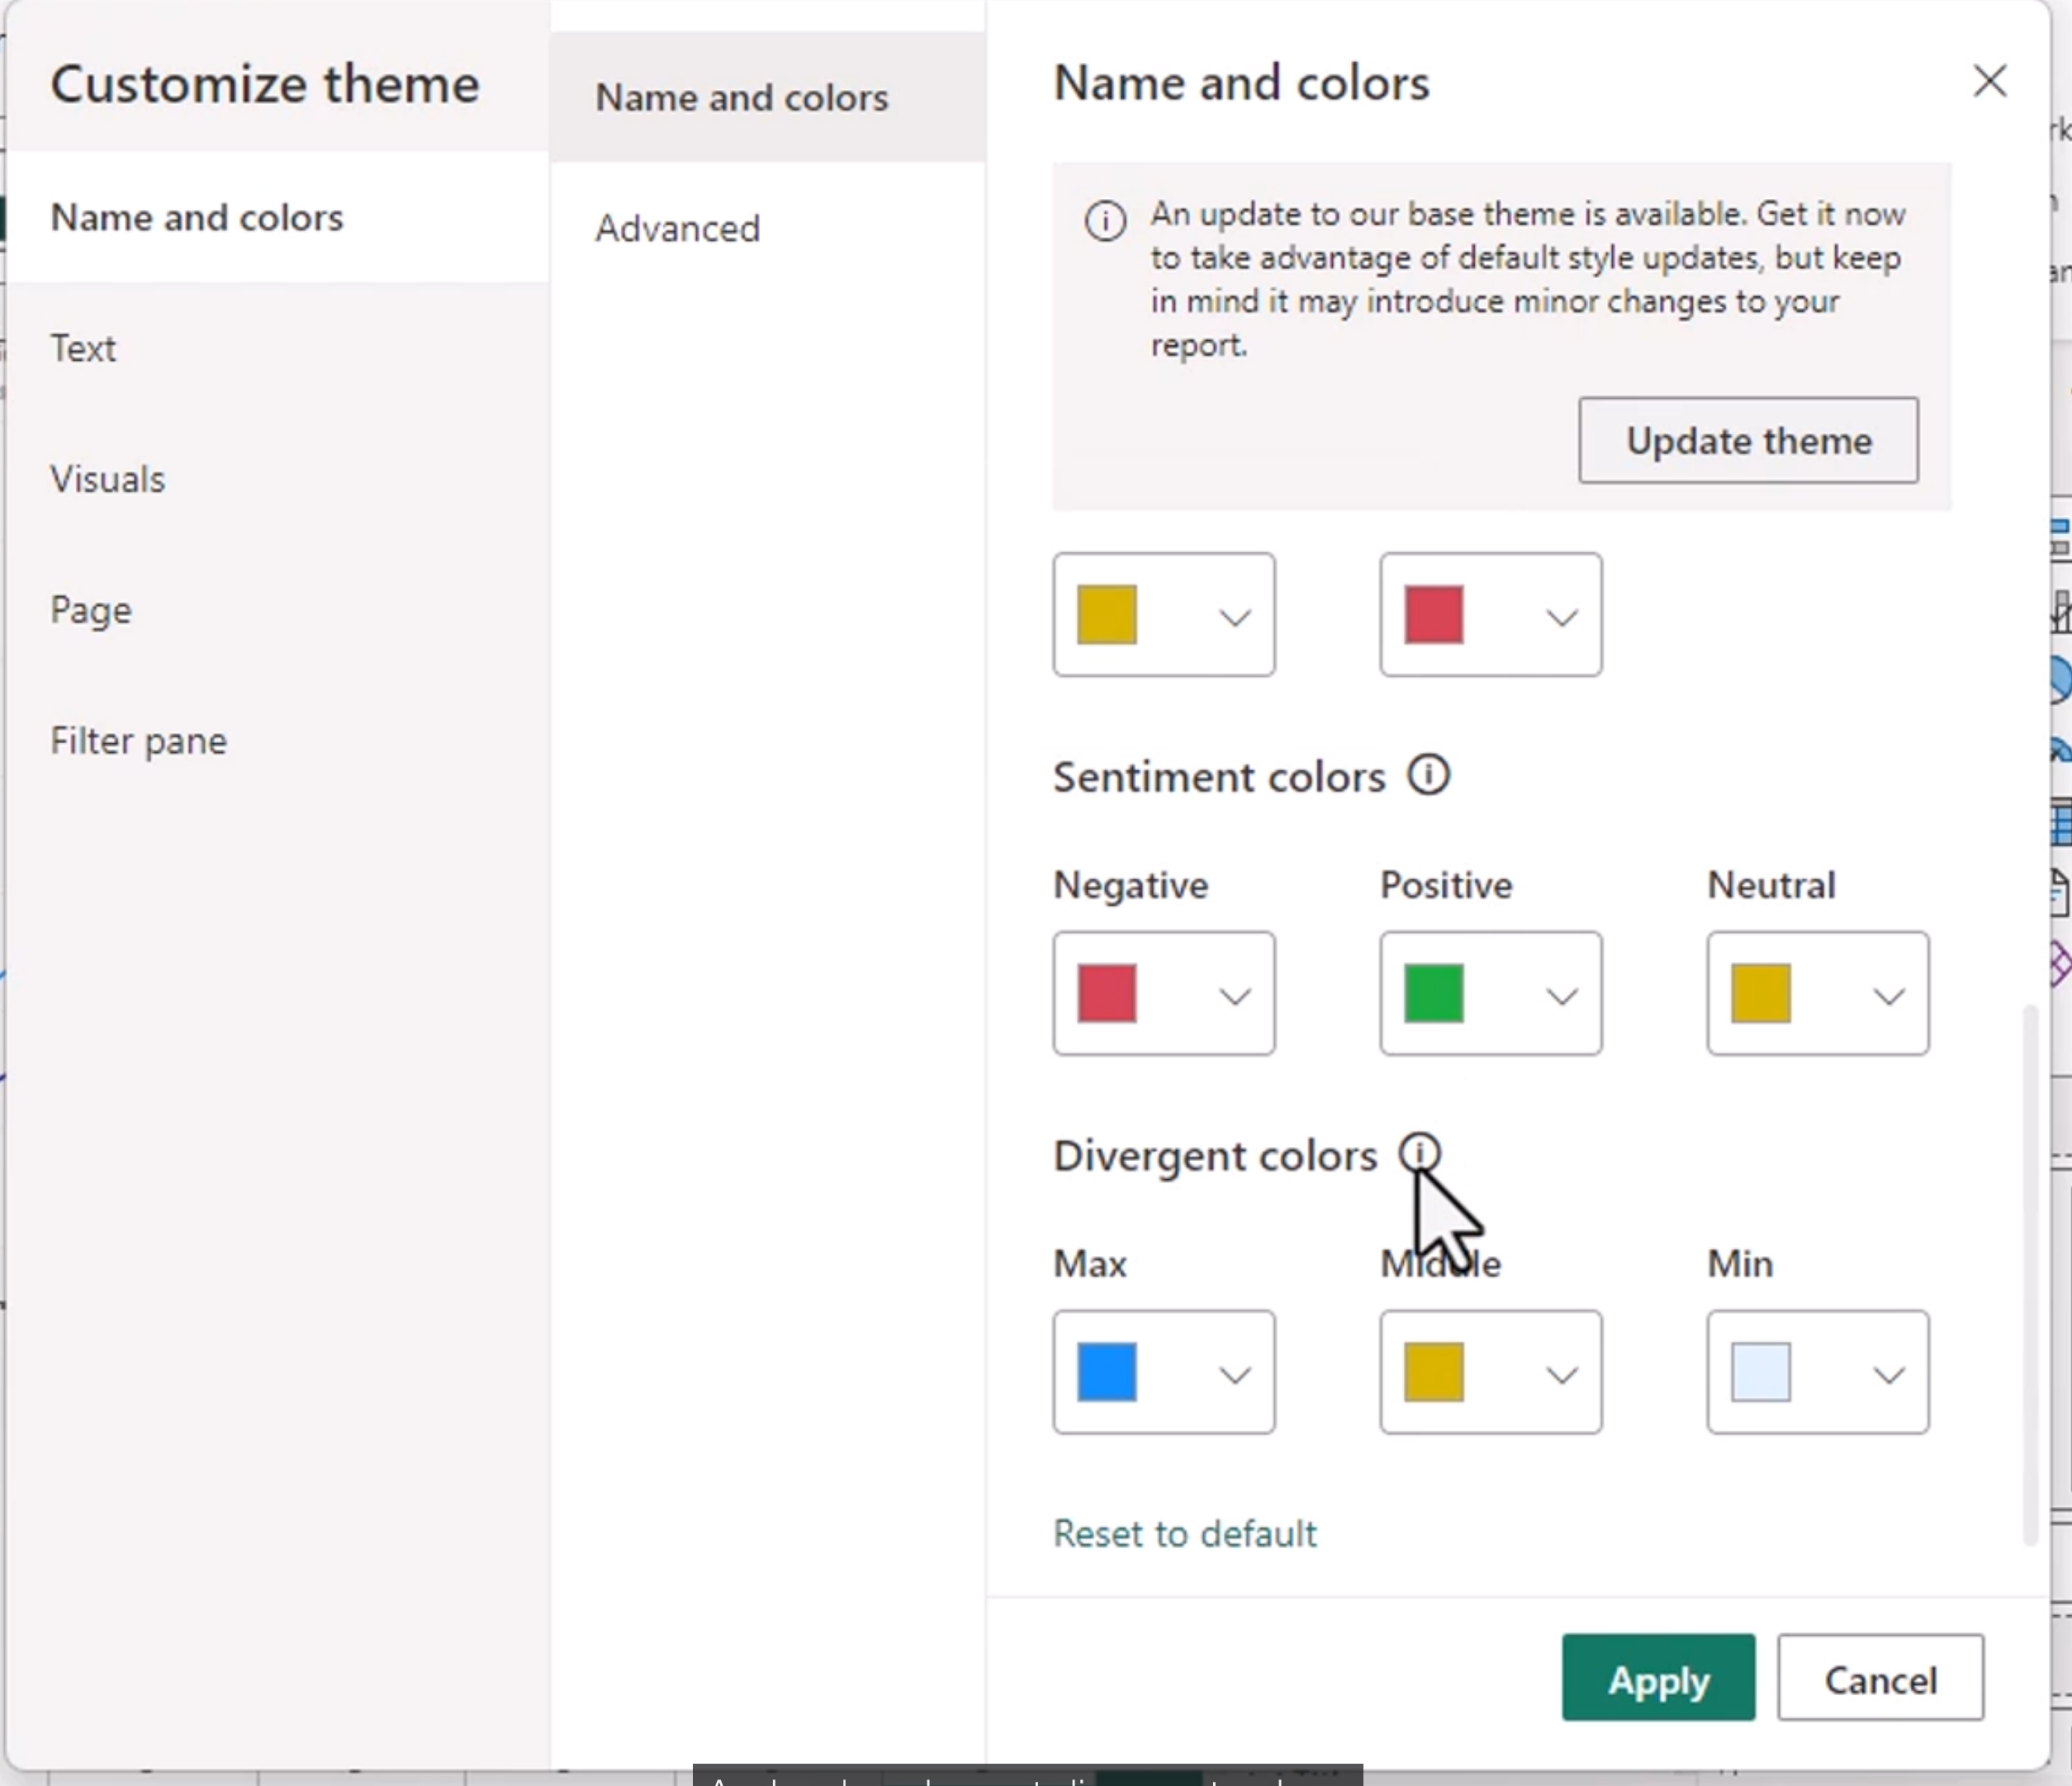
Create a Custom Theme
You can browse for themes, go to a theme gallery or customize the current theme.
Creating a paginated report
A paginated report is designed for precise, printable output. Unlike an interactive dashboard page, it can flow across many pages and repeat headers, footers, and table columns. Paginated reports are useful for invoices, statements, operational listings, and other documents where the reader needs every row rather than a summarized visual.
You can use Power BI Report Builder from Microsoft (installed separately, free) This used to be SQL Report Server
You cannot connect to local sources, only remote Dataverse, Synapse or SQL databases
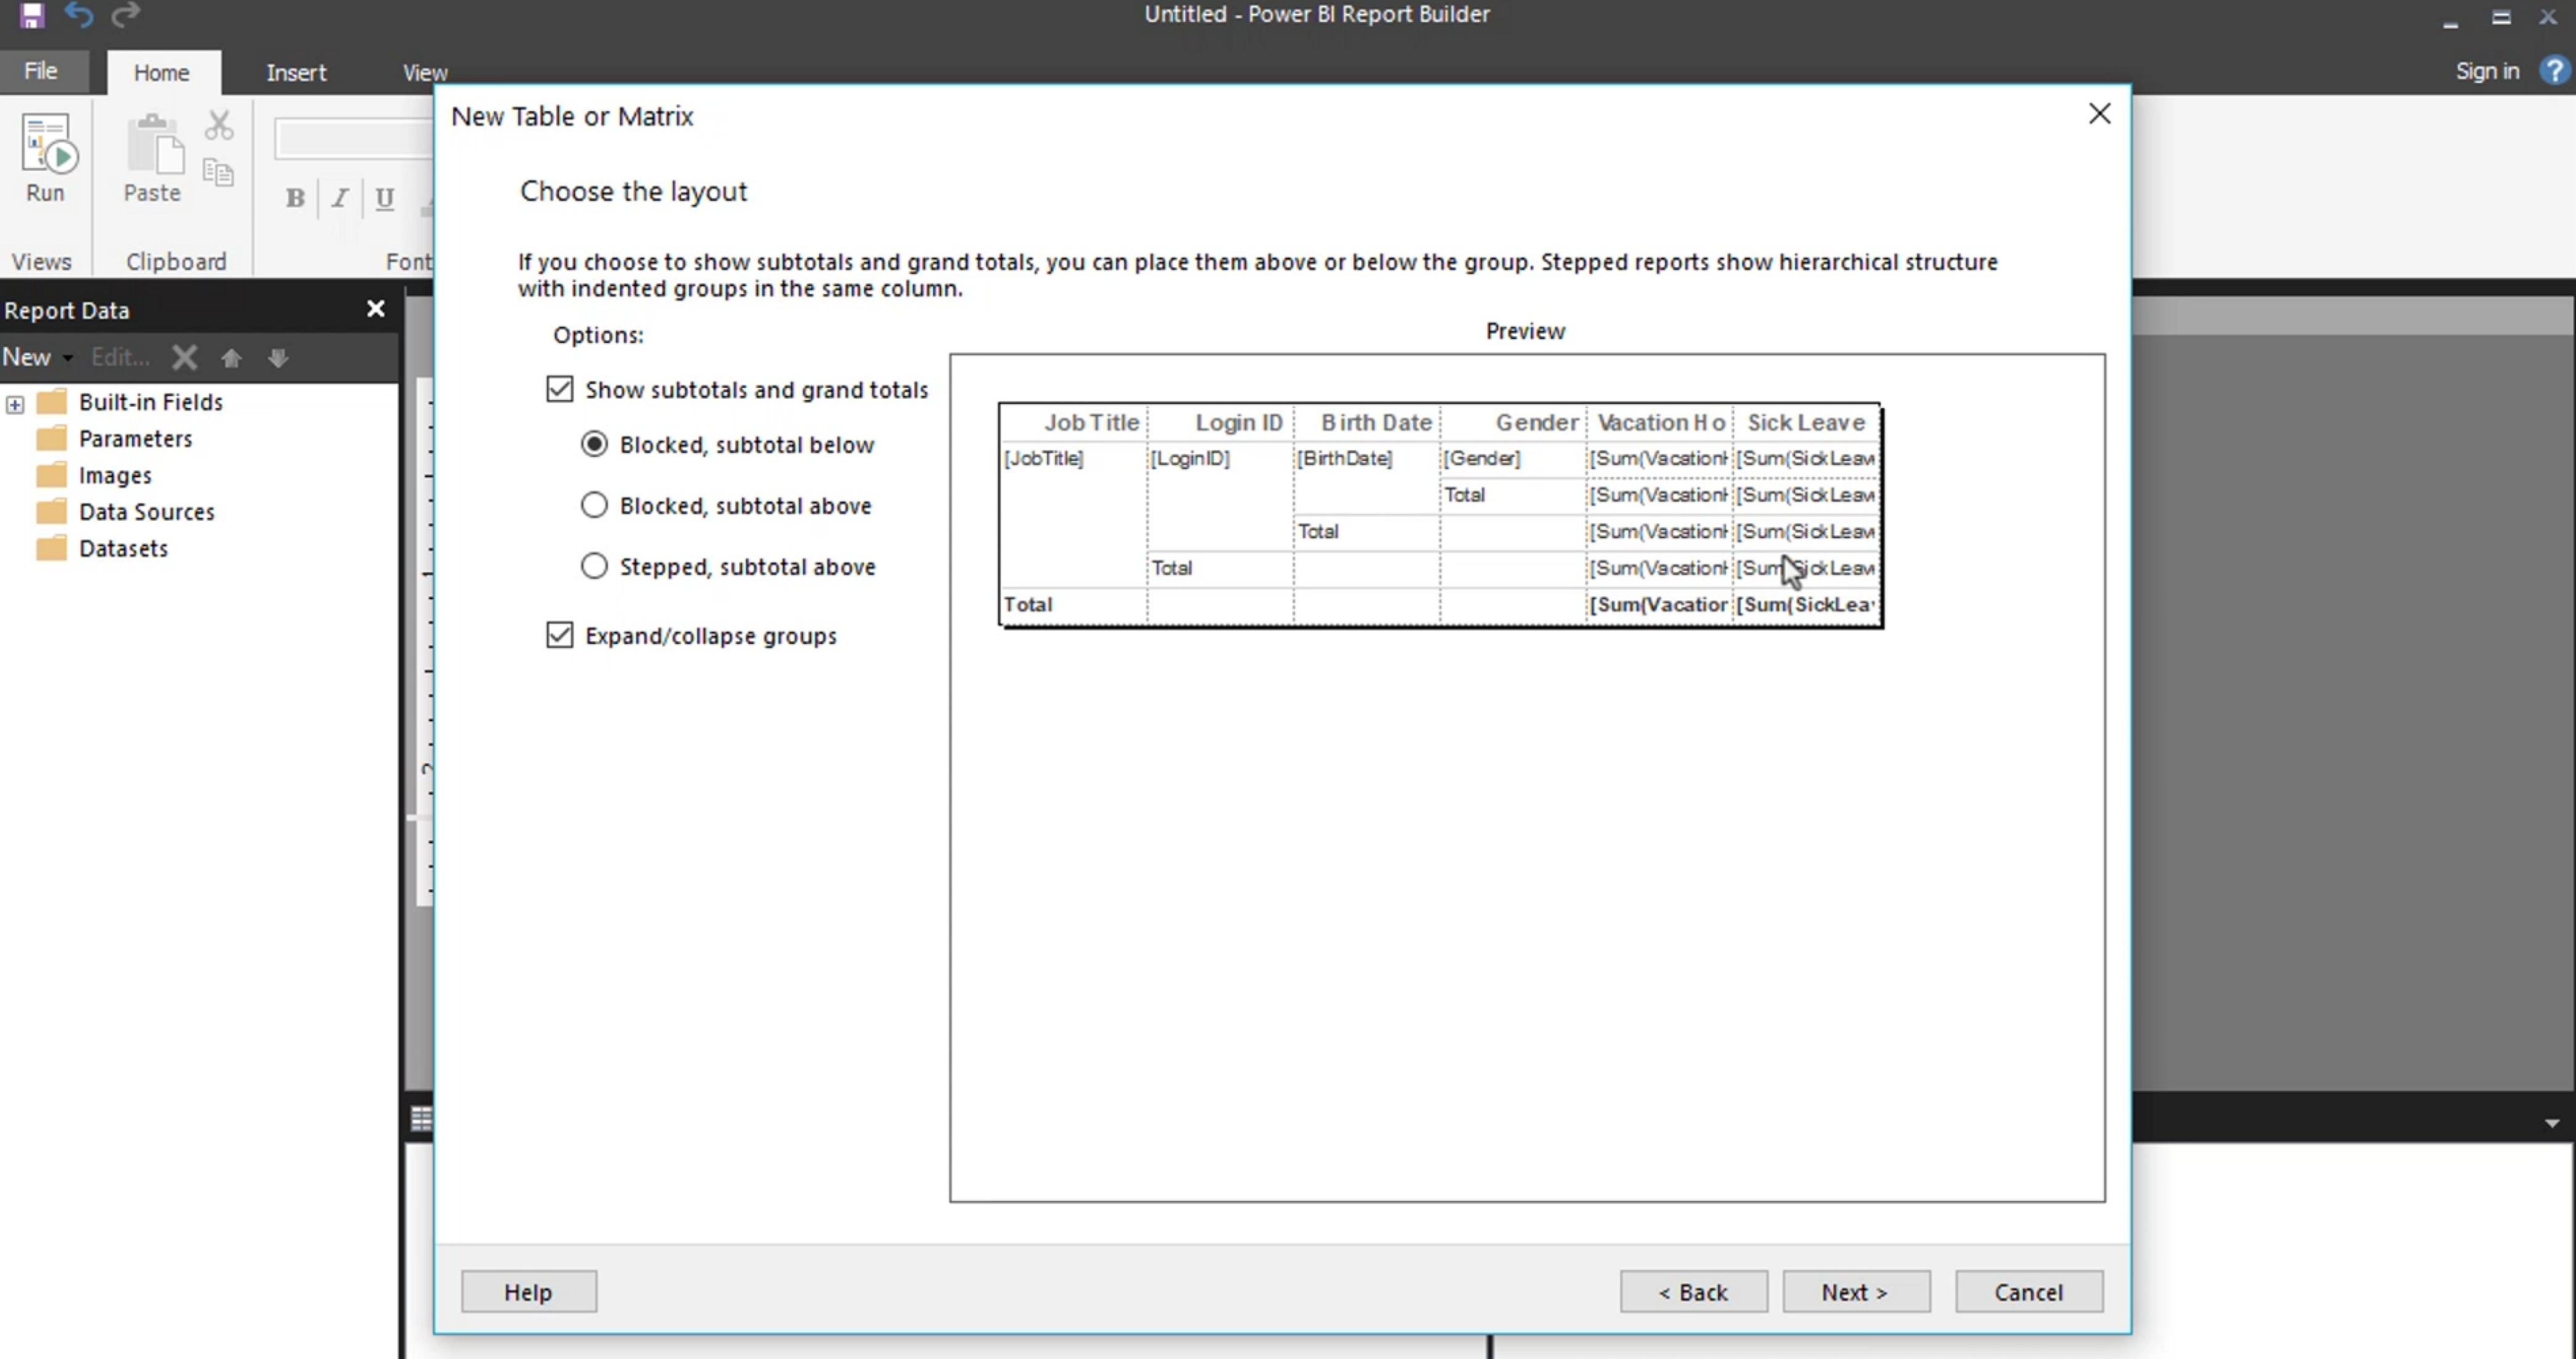
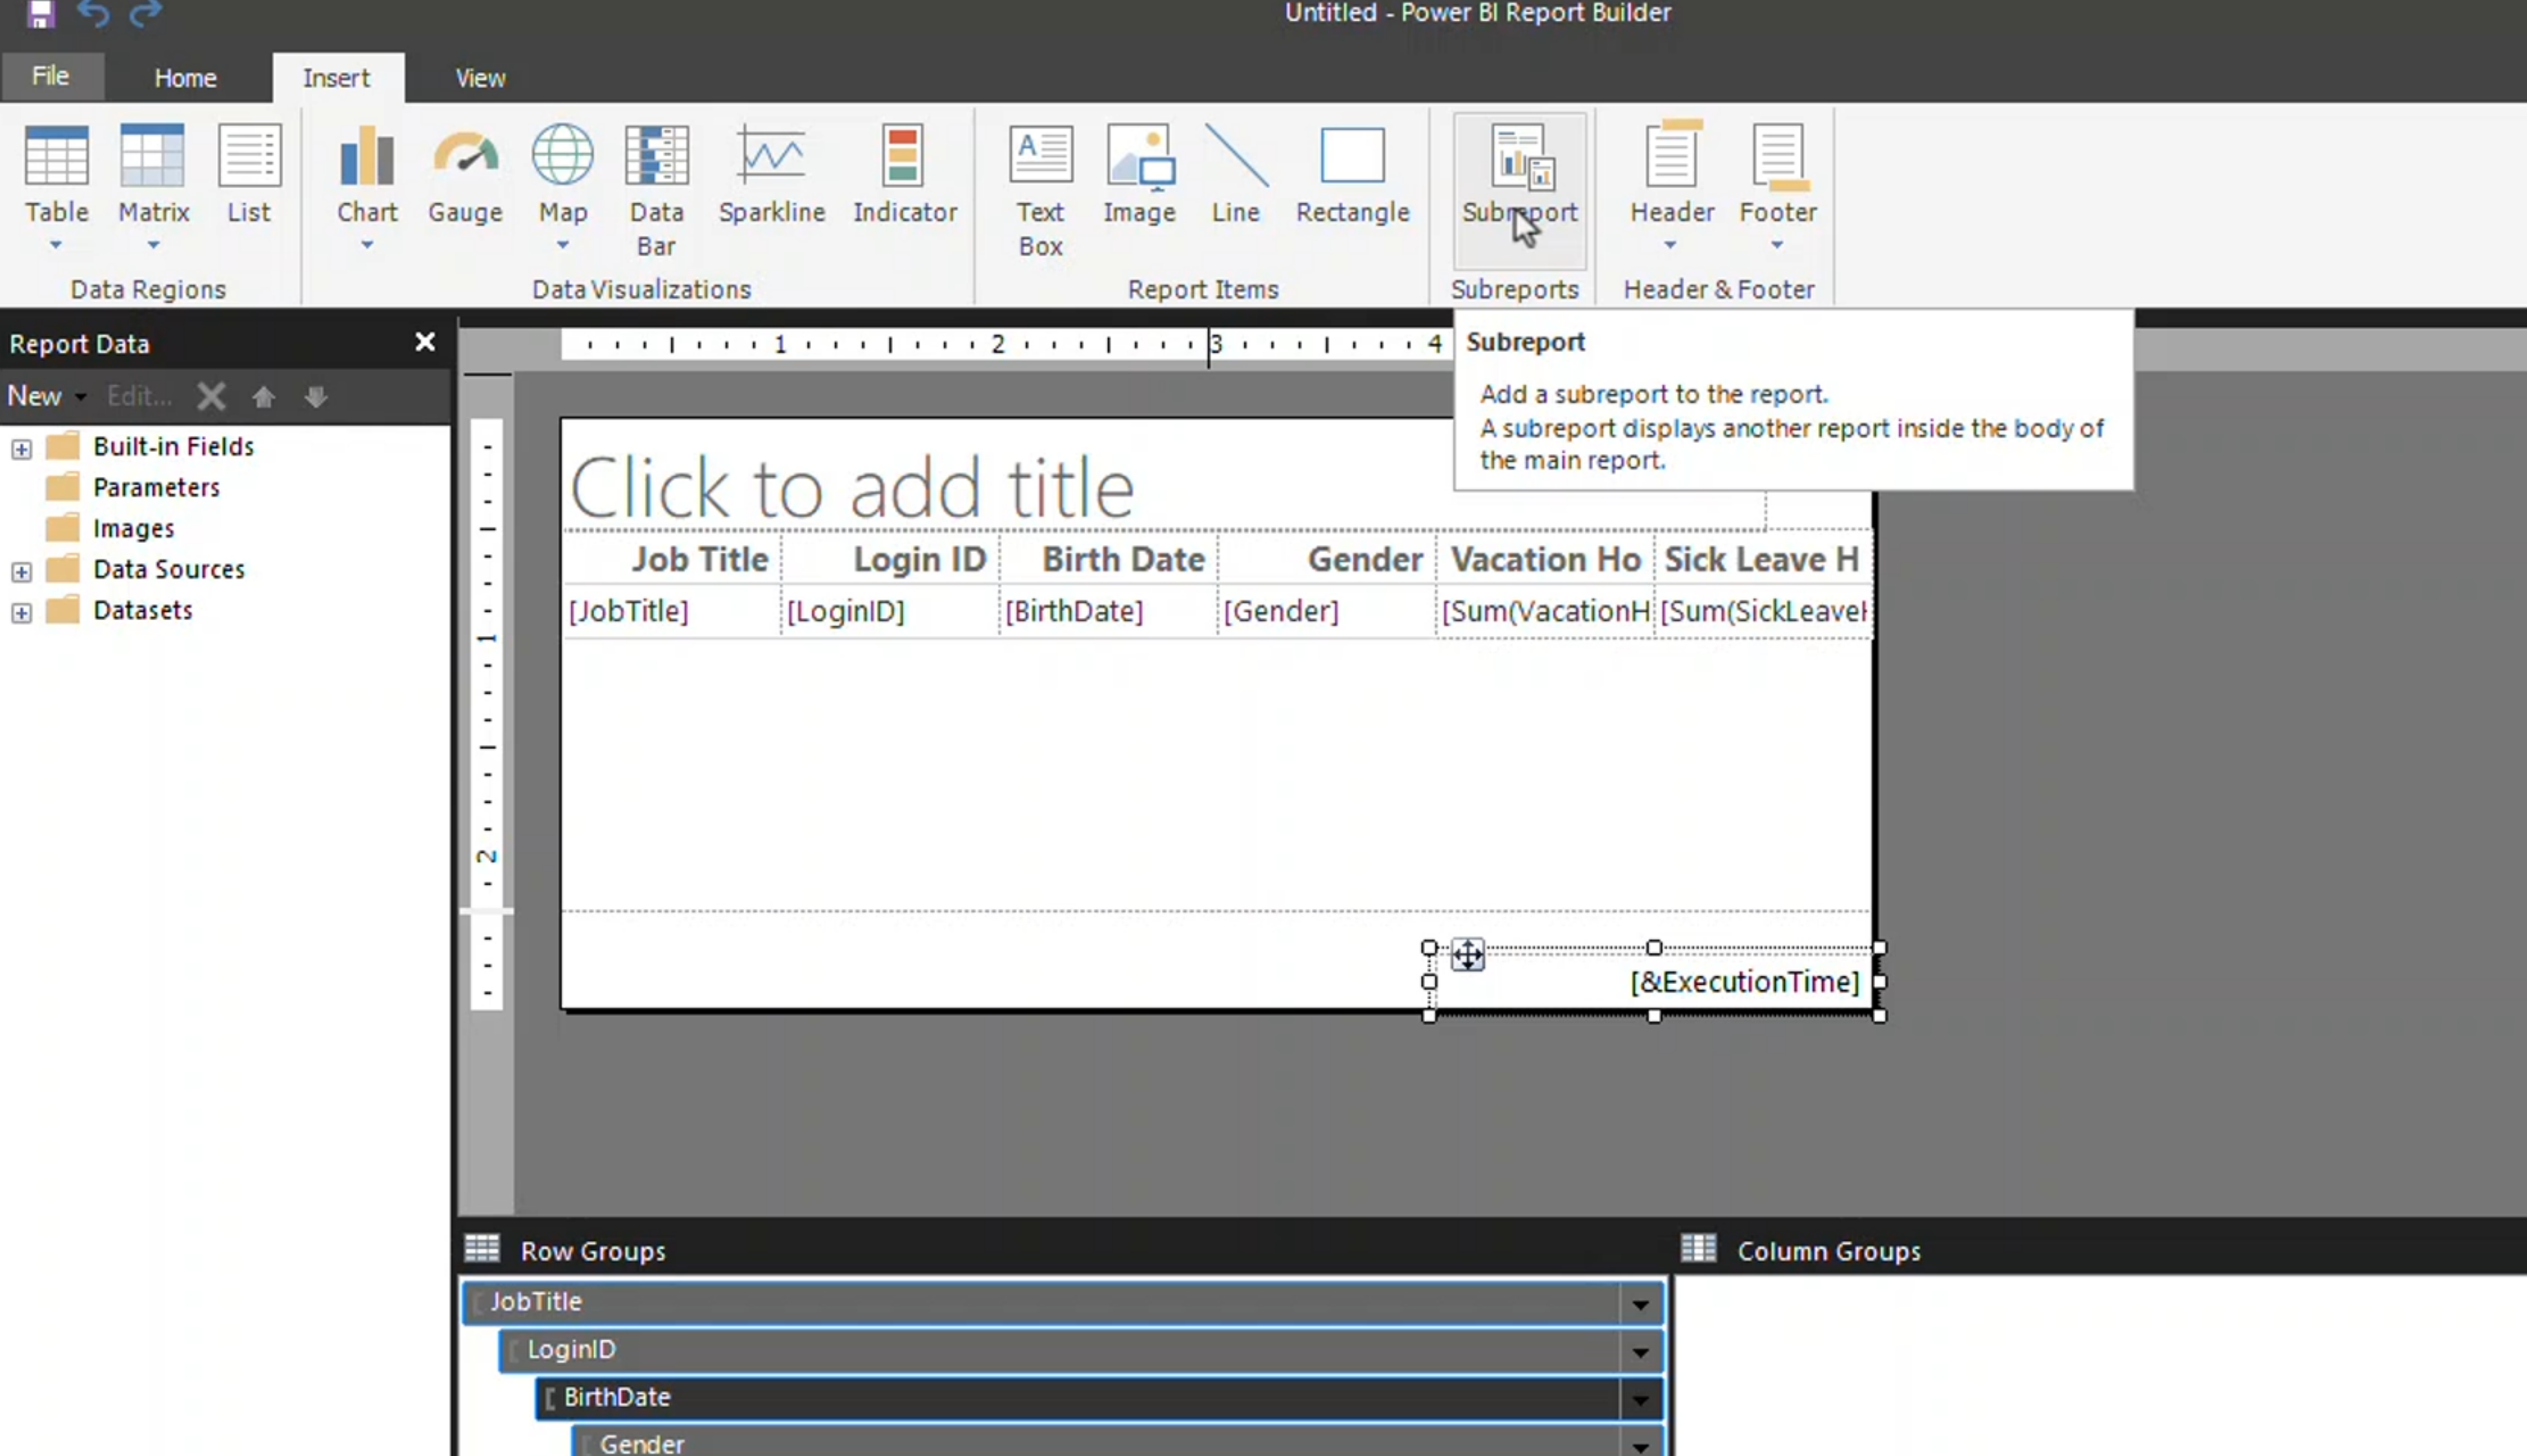
Paginated reports are useful for invoices, statements, operational listings, and other documents where the reader needs every row rather than a summarized visual. They can flow across many pages and repeat headers, footers, and table columns.
Parameters allow the reader or subscription process to filter the report, for example by date range, department, or customer. Give parameters clear labels, sensible defaults, and validation so a report cannot be run with an invalid or unnecessarily broad selection.
Module 13 Summary
Module 13 focuses on advanced analytical visuals and report design:
- Key influencers helps investigate factors associated with an outcome.
- Top segments identifies groups of records that share conditions linked to the result.
- Analyze features help discover distributions and differences for further investigation.
- The decomposition tree breaks a measure down across multiple dimensions.
- Accessibility requires keyboard navigation, clear labels, contrast, and more than color alone.
- Themes provide consistent visual formatting across a report.
- Paginated reports are designed for detailed, printable, parameterized output.
These tools accelerate exploration, but they do not remove the need for data validation. Use them to discover possible explanations, then confirm the result with the model, filters, and business context.